Oracle 2012 Annual Report Download - page 70
Download and view the complete annual report
Please find page 70 of the 2012 Oracle annual report below. You can navigate through the pages in the report by either clicking on the pages listed below, or by using the keyword search tool below to find specific information within the annual report.-
 1
1 -
2
-
3
-
4
-
5
-
6
-
7
-
8
-
9
-
10
-
11
-
12
-
13
-
14
-
15
-
16
-
17
-
18
-
19
-
20
-
21
-
22
-
23
-
24
-
25
-
26
-
27
-
28
-
29
-
30
-
31
-
32
-
33
-
34
-
35
-
36
-
37
-
38
-
39
-
40
-
41
-
42
-
43
-
44
-
45
-
46
-
47
-
48
-
49
-
50
-
51
-
52
-
53
-
54
-
55
-
56
-
57
-
58
-
59
-
 60
60 -
 61
61 -
 62
62 -
 63
63 -
 64
64 -
 65
65 -
 66
66 -
 67
67 -
 68
68 -
 69
69 -
 70
70 -
 71
71 -
 72
72 -
 73
73 -
 74
74 -
 75
75 -
 76
76 -
 77
77 -
 78
78 -
 79
79 -
 80
80 -
81
-
82
-
83
-
84
-
85
-
86
-
87
-
88
-
89
-
90
-
91
-
92
-
93
-
94
-
95
-
96
-
97
-
98
-
99
-
100
-
101
-
102
-
103
-
104
-
105
-
106
-
107
-
108
-
109
-
110
-
111
-
112
-
113
-
114
-
115
-
116
-
117
-
118
-
119
-
120
-
121
-
122
-
123
-
124
-
125
-
126
-
127
-
128
-
129
-
130
-
131
-
132
-
133
-
134
-
135
-
136
-
137
-
138
-
139
-
140
 |
 |

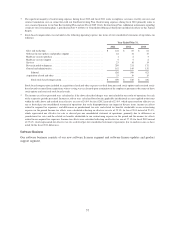
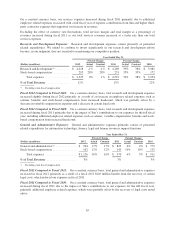
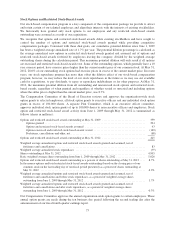
Amortization of Intangible Assets:
Year Ended May 31,
Percent Change Percent Change
(Dollars in millions) 2012 Actual Constant 2011 Actual Constant 2010
Software support agreements and related relationships ........... $ 585 3% 3% $ 570 -1% -1% $ 574
Hardware systems support agreements and related relationships . . . 119 1% 1% 118 300% 300% 29
Developed technology .................................... 923 -7% -7% 992 22% 22% 811
Core technology ......................................... 337 9% 9% 308 11% 11% 277
Customer relationships and contract backlog .................. 370 2% 2% 363 55% 55% 234
Cloud software subscriptions and related relationships ........... 33 267% 267% 9 * * —
Trademarks ............................................. 63 -7% -7% 68 41% 41% 48
Total amortization of intangible assets ................... $ 2,430 0% 0% $ 2,428 23% 23% $ 1,973
* Not meaningful
Fiscal 2012 Compared to Fiscal 2011: Amortization of intangible assets in fiscal 2012 in comparison to fiscal
2011 was flat as additional amortization from intangible assets that we acquired from our acquisitions of
RightNow and Taleo in fiscal 2012 and from our acquisitions of ATG and Phase Forward in fiscal 2011, amongst
others, were offset by a reduction in expenses associated with certain of our intangible assets that became fully
amortized. Note 7 of Notes to Consolidated Financial Statements included elsewhere in this Annual Report has
additional information regarding our intangible assets and related amortization.
Fiscal 2011 Compared to Fiscal 2010: Amortization of intangible assets increased in fiscal 2011 in
comparison to fiscal 2010 due to additional amortization from intangible assets that we acquired including our
acquisitions of ATG and Phase Forward in fiscal 2011 and our acquisition of Sun in fiscal 2010. These increases
were partially offset by a reduction in expenses associated with certain of our intangible assets that became fully
amortized.
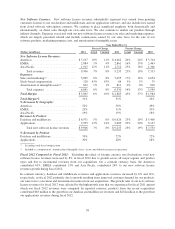
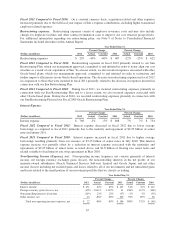
Acquisition Related and Other Expenses: Acquisition related and other expenses consist of personnel related
costs for transitional and certain other employees, stock-based compensation expenses, integration related
professional services, certain business combination adjustments including certain adjustments after the
measurement period has ended and changes in fair value of contingent consideration payable (see Note 2 of
Notes to Consolidated Financial Statements included elsewhere in this Annual Report) and certain other
operating expenses, net. Stock-based compensation expenses included in acquisition related and other expenses
resulted from unvested stock options and restricted stock-based awards assumed from acquisitions whereby
vesting was accelerated upon termination of the employees pursuant to the original terms of those stock options
and restricted stock-based awards.
Year Ended May 31,
Percent Change Percent Change
(Dollars in millions) 2012 Actual Constant 2011 Actual Constant 2010
Transitional and other employee related costs ..... $ 25 -81% -81% $ 129 94% 86% $ 66
Stock-based compensation .................... 33 254% 254% 10 -37% -37% 15
Professional fees and other, net ................. 13 -81% -83% 66 -2% -4% 68
Business combination adjustments, net ........... (15) -499% -515% 3 -28% -78% 5
Total acquisition related and other expenses . . . $ 56 -73% -74% $ 208 35% 27% $ 154
Fiscal 2012 Compared to Fiscal 2011: On a constant currency basis, the decrease in acquisition related and
other expenses during fiscal 2012 was primarily due to lower transitional employee related costs and professional
services expenses in comparison to those that were incurred in fiscal 2011 (primarily related to our acquisition of
Sun), and was also due to a benefit from a business combination related legal settlement, which reduced our
fiscal 2012 expenses. These expense reductions were partially offset by an increase in stock-based compensation
expenses associated with our recent acquisitions and expenses associated with the change in fair value of
contingent consideration payable (see Note 2 of Notes to Consolidated Financial Statements included elsewhere
in this Annual Report).
66