Oracle 2012 Annual Report Download - page 68
Download and view the complete annual report
Please find page 68 of the 2012 Oracle annual report below. You can navigate through the pages in the report by either clicking on the pages listed below, or by using the keyword search tool below to find specific information within the annual report.-
 1
1 -
2
-
3
-
4
-
5
-
6
-
7
-
8
-
9
-
10
-
11
-
12
-
13
-
14
-
15
-
16
-
17
-
18
-
19
-
20
-
21
-
22
-
23
-
24
-
25
-
26
-
27
-
28
-
29
-
30
-
31
-
32
-
33
-
34
-
35
-
36
-
37
-
38
-
39
-
40
-
41
-
42
-
43
-
44
-
45
-
46
-
47
-
48
-
49
-
50
-
51
-
52
-
53
-
54
-
55
-
56
-
57
-
 58
58 -
 59
59 -
 60
60 -
 61
61 -
 62
62 -
 63
63 -
 64
64 -
 65
65 -
 66
66 -
 67
67 -
 68
68 -
 69
69 -
 70
70 -
 71
71 -
 72
72 -
 73
73 -
 74
74 -
 75
75 -
 76
76 -
 77
77 -
 78
78 -
79
-
80
-
81
-
82
-
83
-
84
-
85
-
86
-
87
-
88
-
89
-
90
-
91
-
92
-
93
-
94
-
95
-
96
-
97
-
98
-
99
-
100
-
101
-
102
-
103
-
104
-
105
-
106
-
107
-
108
-
109
-
110
-
111
-
112
-
113
-
114
-
115
-
116
-
117
-
118
-
119
-
120
-
121
-
122
-
123
-
124
-
125
-
126
-
127
-
128
-
129
-
130
-
131
-
132
-
133
-
134
-
135
-
136
-
137
-
138
-
139
-
140
 |
 |

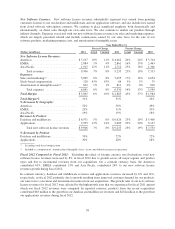
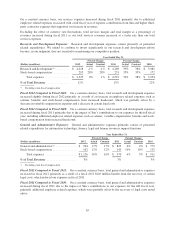
Services Business
Our services business consists of consulting, managed cloud services and education services. Consulting
revenues are earned by providing services to customers in business and IT strategy alignment, enterprise
architecture planning and design, initial product implementation and integration and ongoing product
enhancements and upgrades. Managed cloud services revenues are earned by providing services for
comprehensive software and hardware management and maintenance services for customers hosted at our Oracle
data center facilities, select partner data centers or physically on-premise at customer facilities. Additionally, we
provide support services, both on-premise and remote, to customers to enable increased performance and higher
availability of their products and services. Education revenues are earned by providing instructor-led, media-
based and internet-based training in the use of our software and hardware products. The cost of providing our
services consists primarily of personnel related expenses, technology infrastructure expenditures, facilities
expenses and external contractor expenses.
Year Ended May 31,
Percent Change Percent Change
(Dollars in millions) 2012 Actual Constant 2011 Actual Constant 2010
Services Revenues:
Americas ............................ $ 2,420 2% 2% $ 2,376 21% 20% $ 1,967
EMEA .............................. 1,473 -1% -1% 1,493 11% 10% 1,346
Asia Pacific .......................... 810 4% 3% 778 32% 23% 592
Total revenues .................... 4,703 1% 1% 4,647 19% 17% 3,905
Expenses:
Services(1) ........................... 3,720 -2% -2% 3,802 12% 11% 3,384
Stock-based compensation .............. 23 39% 39% 16 17% 17% 14
Amortization of intangible assets(2) ........ 47 -27% -27% 66 12% 12% 58
Total expenses .................... 3,790 -2% -2% 3,884 12% 11% 3,456
Total Margin ........................ $ 913 20% 19% $ 763 70% 63% $ 449
Total Margin % ...................... 19% 16% 11%
% Revenues by Geography:
Americas ............................ 52% 51% 50%
EMEA .............................. 31% 32% 35%
Asia Pacific .......................... 17% 17% 15%
(1) Excluding stock-based compensation
(2) Included as a component of ‘Amortization of Intangible Assets’ in our consolidated statements of operations
Fiscal 2012 Compared to Fiscal 2011: Excluding the effect of currency rate fluctuations, our services revenues
increased modestly in fiscal 2012 due to increased consulting and managed cloud services revenues including
incremental contributions from our recently acquired companies, which were partially offset by decreases in our
education revenues.
On a constant currency basis, our services expenses decreased during fiscal 2012 due to lower third-party
contractor expenses associated with our managed cloud services offerings, lower intangible asset amortization
and certain other net expense reductions.
Excluding the effect of currency rate fluctuations, total services margin and total margin as a percentage of
revenues increased during fiscal 2012 as our total services revenues increased while our total services expenses
decreased.
Fiscal 2011 Compared to Fiscal 2010: Excluding the effect of currency rate fluctuations, the increase in our
services revenues in fiscal 2011 was due to increases in our managed cloud services revenues resulting from the
full fiscal year impact of revenue contributions from our acquisition of Sun.
64