Oracle 2012 Annual Report Download - page 72
Download and view the complete annual report
Please find page 72 of the 2012 Oracle annual report below. You can navigate through the pages in the report by either clicking on the pages listed below, or by using the keyword search tool below to find specific information within the annual report.-
 1
1 -
2
-
3
-
4
-
5
-
6
-
7
-
8
-
9
-
10
-
11
-
12
-
13
-
14
-
15
-
16
-
17
-
18
-
19
-
20
-
21
-
22
-
23
-
24
-
25
-
26
-
27
-
28
-
29
-
30
-
31
-
32
-
33
-
34
-
35
-
36
-
37
-
38
-
39
-
40
-
41
-
42
-
43
-
44
-
45
-
46
-
47
-
48
-
49
-
50
-
51
-
52
-
53
-
54
-
55
-
56
-
57
-
58
-
59
-
60
-
61
-
 62
62 -
 63
63 -
 64
64 -
 65
65 -
 66
66 -
 67
67 -
 68
68 -
 69
69 -
 70
70 -
 71
71 -
 72
72 -
 73
73 -
 74
74 -
 75
75 -
 76
76 -
 77
77 -
 78
78 -
 79
79 -
 80
80 -
 81
81 -
 82
82 -
83
-
84
-
85
-
86
-
87
-
88
-
89
-
90
-
91
-
92
-
93
-
94
-
95
-
96
-
97
-
98
-
99
-
100
-
101
-
102
-
103
-
104
-
105
-
106
-
107
-
108
-
109
-
110
-
111
-
112
-
113
-
114
-
115
-
116
-
117
-
118
-
119
-
120
-
121
-
122
-
123
-
124
-
125
-
126
-
127
-
128
-
129
-
130
-
131
-
132
-
133
-
134
-
135
-
136
-
137
-
138
-
139
-
140
 |
 |

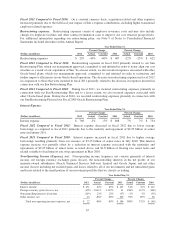
Fiscal 2012 Compared to Fiscal 2011: On a constant currency basis, our non-operating income, net decreased
in fiscal 2012 primarily as a result of net foreign currency transaction losses incurred in fiscal 2012 in
comparison to net foreign currency transaction gains incurred in fiscal 2011. In addition, we incurred a decrease
in other income, net, which was attributable to net gains recorded in fiscal 2011 due to favorable changes in the
values of our marketable securities that we classify as trading that are held to support our deferred compensation
plan obligations. These unfavorable variations to non-operating income, net were partially offset by increases in
interest income during fiscal 2012 due to larger average cash, cash equivalents and marketable securities
balances in comparison to fiscal 2011.
Fiscal 2011 Compared to Fiscal 2010: We recorded non-operating income, net during fiscal 2011 in
comparison to non-operating expense, net in fiscal 2010 primarily due to net foreign currency transaction losses
incurred in fiscal 2010, which included a foreign currency remeasurement loss of $81 million resulting from the
designation of our Venezuelan subsidiary as “highly inflationary” in accordance with the FASB’s ASC 830,
Foreign Currency Matters, and the subsequent devaluation of the Venezuelan currency by the Venezuelan
government. In addition, our interest income increased in fiscal 2011 due to larger average cash, cash equivalents
and marketable securities balances and other income, net increased in fiscal 2011 as a result of gains recognized
on the sale of certain equity investments.
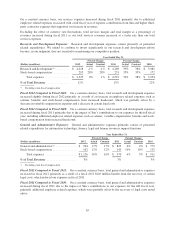
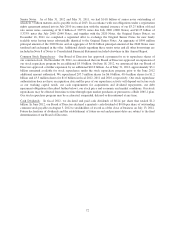
Provision for Income Taxes: Our effective tax rate in all periods is the result of the mix of income earned in
various tax jurisdictions that apply a broad range of income tax rates. The provision for income taxes differs from
the tax computed at the U.S. federal statutory income tax rate due primarily to earnings considered as indefinitely
reinvested in foreign operations, state taxes, the U.S. research and development tax credit and the U.S. domestic
production activity deduction. Future effective tax rates could be adversely affected if earnings are lower than
anticipated in countries where we have lower statutory tax rates, by unfavorable changes in tax laws and
regulations or by adverse rulings in tax related litigation.
Year Ended May 31,
Percent Change Percent Change
(Dollars in millions) 2012 Actual Constant 2011 Actual Constant 2010
Provision for income taxes ...... $ 2,981 4% 4% $ 2,864 36% 32% $ 2,108
Effective tax rate .............. 23.0% 25.1% 25.6%
Fiscal 2012 Compared to Fiscal 2011: Provision for income taxes increased during fiscal 2012 due
substantially to higher income before provision for income taxes, partially offset by the favorable effects of an
increase in the number of foreign subsidiaries in countries with lower statutory rates than the United States, the
earnings of which we consider to be indefinitely reinvested outside the United States. If these subsidiaries
generate sufficient earnings in the future, our provision for income taxes may continue to be favorably affected to
a meaningful extent, although any such favorable effects could be significantly reduced under a variety of
circumstances.
Fiscal 2011 Compared to Fiscal 2010: Provision for income taxes increased during fiscal 2011 due
substantially to higher income before provision for income taxes and a reduction in the impact of favorable
judicial decisions and settlements with worldwide taxing authorities.
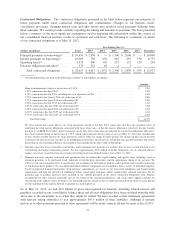
Liquidity and Capital Resources
As of May 31,
(Dollars in millions) 2012 Change 2011 Change 2010
Working capital ........................... $ 24,635 -1% $ 24,982 103% $ 12,313
Cash, cash equivalents and marketable securities . .
$ 30,676 6% $ 28,848 56% $ 18,469
Working capital: The decrease in working capital as of May 31, 2012 in comparison to May 31, 2011 was
primarily due to an increase in our stock repurchases during fiscal 2012 in comparison to fiscal 2011 (we used
$5.9 billion of cash for stock repurchases during fiscal 2012 in comparison to $1.2 billion used for stock
repurchases during fiscal 2011), the reclassification of $1.25 billion of our senior notes due April 2013 as a
68