Oracle 2012 Annual Report Download - page 73
Download and view the complete annual report
Please find page 73 of the 2012 Oracle annual report below. You can navigate through the pages in the report by either clicking on the pages listed below, or by using the keyword search tool below to find specific information within the annual report.-
 1
1 -
2
-
3
-
4
-
5
-
6
-
7
-
8
-
9
-
10
-
11
-
12
-
13
-
14
-
15
-
16
-
17
-
18
-
19
-
20
-
21
-
22
-
23
-
24
-
25
-
26
-
27
-
28
-
29
-
30
-
31
-
32
-
33
-
34
-
35
-
36
-
37
-
38
-
39
-
40
-
41
-
42
-
43
-
44
-
45
-
46
-
47
-
48
-
49
-
50
-
51
-
52
-
53
-
54
-
55
-
56
-
57
-
58
-
59
-
60
-
61
-
62
-
 63
63 -
 64
64 -
 65
65 -
 66
66 -
 67
67 -
 68
68 -
 69
69 -
 70
70 -
 71
71 -
 72
72 -
 73
73 -
 74
74 -
 75
75 -
 76
76 -
 77
77 -
 78
78 -
 79
79 -
 80
80 -
 81
81 -
 82
82 -
 83
83 -
84
-
85
-
86
-
87
-
88
-
89
-
90
-
91
-
92
-
93
-
94
-
95
-
96
-
97
-
98
-
99
-
100
-
101
-
102
-
103
-
104
-
105
-
106
-
107
-
108
-
109
-
110
-
111
-
112
-
113
-
114
-
115
-
116
-
117
-
118
-
119
-
120
-
121
-
122
-
123
-
124
-
125
-
126
-
127
-
128
-
129
-
130
-
131
-
132
-
133
-
134
-
135
-
136
-
137
-
138
-
139
-
140
 |
 |

current liability, cash used for acquisitions and cash used to pay dividends to our stockholders. These decreases
to working capital were almost entirely offset by the favorable impact to our net current assets resulting from our
net income during fiscal 2012. Our working capital may be impacted by some of the aforementioned factors in
future periods, certain amounts and timing of which are variable.
The increase in working capital as of May 31, 2011 in comparison to May 31, 2010 was primarily due to the
favorable impact to our net current assets resulting from our net income during fiscal 2011 and our issuance of
$3.25 billion of long-term senior notes in July 2010. These increases were partially offset by cash used for our
acquisitions, repurchases of our common stock and cash used to pay dividends to our stockholders.
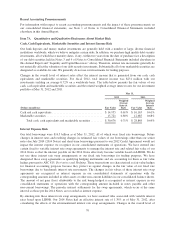
Cash, cash equivalents and marketable securities: Cash and cash equivalents primarily consist of deposits
held at major banks, money market funds, Tier-1 commercial paper, U.S. Treasury obligations, U.S. government
agency and government sponsored enterprise obligations and other securities with original maturities of 90 days
or less. Marketable securities primarily consist of time deposits held at major banks, Tier-1 commercial paper,
corporate notes, U.S. Treasury obligations, U.S. government agency and government sponsored enterprise
obligations and certain other securities. The increase in cash, cash equivalents and marketable securities at
May 31, 2012 in comparison to May 31, 2011 was primarily due to an increase in cash generated from our
operating activities and our short-term borrowing of $1.7 billion made pursuant to a revolving credit agreement.
These increases in cash, cash equivalents and marketable securities were partially offset by our June 2011
repayment of $1.15 billion of short-term borrowings pursuant to our expired revolving credit facilities, $255
million of cash used to repay RightNow’s legacy convertible notes after the closing of the acquisition, the use of
$4.7 billion of net cash for acquisitions, the repurchases of our common stock (see discussion above) and the
payment of cash dividends to our stockholders. Cash, cash equivalents and marketable securities included $26.8
billion held by our foreign subsidiaries as of May 31, 2012, $20.9 billion of which we consider indefinitely
reinvested earnings outside the United States. These undistributed earnings would be subject to U.S. income tax
if repatriated to the United States. Assuming a full utilization of the foreign tax credits, the potential deferred tax
liability associated with these undistributed earnings would be approximately $6.3 billion as of May 31, 2012.
The amount of cash, cash equivalents and marketable securities that we report in U.S. Dollars for a significant
portion of the cash held by our foreign subsidiaries is subject to translation adjustments caused by changes in
foreign currency exchange rates as of the end of each respective reporting period (the offset to which is recorded
to accumulated other comprehensive income in our consolidated balance sheet). As the U.S. Dollar generally
strengthened against major international currencies during fiscal 2012, the amount of cash, cash equivalents and
marketable securities that we reported in U.S. Dollars for these subsidiaries decreased as of May 31, 2012
relative to what we would have reported using constant currency rates as of May 31, 2011.
The increase in cash, cash equivalents and marketable securities at May 31, 2011 in comparison to May 31, 2010
was primarily due to cash generated from our operating activities, our issuance of $3.25 billion of senior notes in
July 2010 and $1.15 billion of short-term borrowings made pursuant to certain of our revolving credit
agreements. Additionally, cash, cash equivalents and marketable securities balances increased due to the
weakening of the U.S. Dollar in comparison to certain major international currencies during fiscal 2011. These
increases in our cash, cash equivalents and marketable securities balances were partially offset by the repayment
of $2.25 billion of our senior notes which matured in January 2011, the repayment of $881 million of commercial
paper notes, the usage of $1.9 billion of net cash for acquisitions, repurchases of our common stock and the
payments of cash dividends to our stockholders.
Days sales outstanding, which is calculated by dividing period end accounts receivable by average daily sales for
the quarter, was 53 days at May 31, 2012 compared with 55 days at May 31, 2011. The days sales outstanding
calculation excludes the revenue adjustments that primarily reduce our acquired cloud software subscription,
software license updates and product support obligations and hardware systems support obligations to fair value.
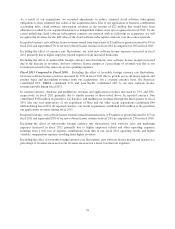
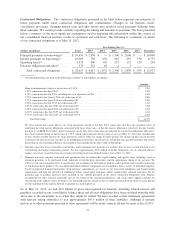
Year Ended May 31,
(Dollars in millions) 2012 Change 2011 Change 2010
Net cash provided by operating activities ............ $ 13,743 23% $ 11,214 29% $ 8,681
Net cash used for investing activities ............... $ (8,381) 38% $ (6,081) -41% $ (10,319)
Net cash (used for) provided by financing activities . . . $ (6,099) 1,282% $ 516 81% $ 2,664
69