Oracle 2012 Annual Report Download - page 109
Download and view the complete annual report
Please find page 109 of the 2012 Oracle annual report below. You can navigate through the pages in the report by either clicking on the pages listed below, or by using the keyword search tool below to find specific information within the annual report.-
 1
1 -
2
-
3
-
4
-
5
-
6
-
7
-
8
-
9
-
10
-
11
-
12
-
13
-
14
-
15
-
16
-
17
-
18
-
19
-
20
-
21
-
22
-
23
-
24
-
25
-
26
-
27
-
28
-
29
-
30
-
31
-
32
-
33
-
34
-
35
-
36
-
37
-
38
-
39
-
40
-
41
-
42
-
43
-
44
-
45
-
46
-
47
-
48
-
49
-
50
-
51
-
52
-
53
-
54
-
55
-
56
-
57
-
58
-
59
-
60
-
61
-
62
-
63
-
64
-
65
-
66
-
67
-
68
-
69
-
70
-
71
-
72
-
73
-
74
-
75
-
76
-
77
-
78
-
79
-
80
-
81
-
82
-
83
-
84
-
85
-
86
-
87
-
88
-
89
-
90
-
91
-
92
-
93
-
94
-
95
-
96
-
97
-
98
-
 99
99 -
 100
100 -
 101
101 -
 102
102 -
 103
103 -
 104
104 -
 105
105 -
 106
106 -
 107
107 -
 108
108 -
 109
109 -
 110
110 -
 111
111 -
 112
112 -
 113
113 -
 114
114 -
 115
115 -
 116
116 -
 117
117 -
 118
118 -
 119
119 -
120
-
121
-
122
-
123
-
124
-
125
-
126
-
127
-
128
-
129
-
130
-
131
-
132
-
133
-
134
-
135
-
136
-
137
-
138
-
139
-
140
 |
 |
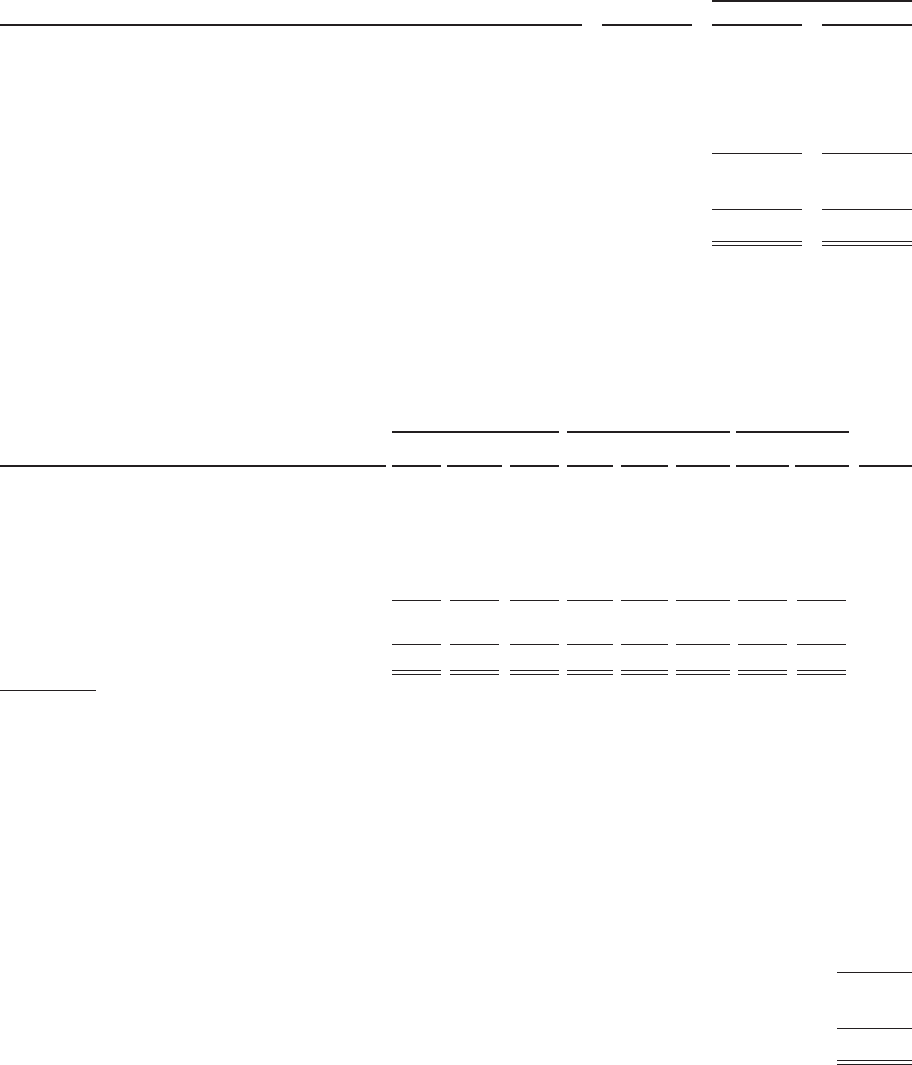
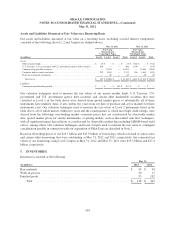
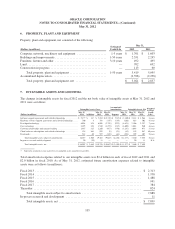
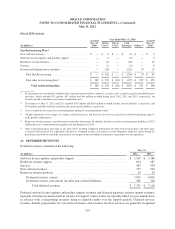
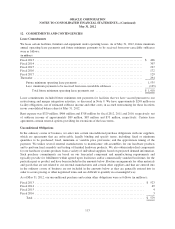
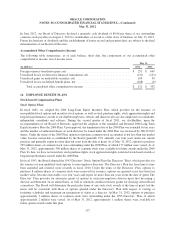
ORACLE CORPORATION
NOTES TO CONSOLIDATED FINANCIAL STATEMENTS—(Continued)
May 31, 2012
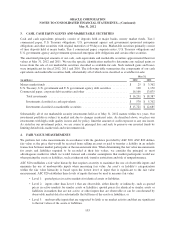
6. PROPERTY, PLANT AND EQUIPMENT
Property, plant and equipment, net consisted of the following:
May 31,
Estimated
(Dollars in millions) Useful Life 2012 2011
Computer, network, machinery and equipment .................... 1-5 years $ 1,761 $ 1,603
Buildings and improvements ................................... 1-50 years 2,351 2,245
Furniture, fixtures and other ................................... 3-10 years 492 495
Land ...................................................... — 702 692
Construction in progress ...................................... — 113 60
Total property, plant and equipment ......................... 1-50 years 5,419 5,095
Accumulated depreciation ..................................... (2,398) (2,238)
Total property, plant and equipment, net ..................... $ 3,021 $ 2,857
7. INTANGIBLE ASSETS AND GOODWILL
The changes in intangible assets for fiscal 2012 and the net book value of intangible assets at May 31, 2012 and
2011 were as follows:
Intangible Assets, Gross Accumulated
Amortization Intangible Assets, Net Weighted
Average
May 31, May 31, May 31, May 31, May 31, May 31, Useful
(Dollars in millions) 2011 Additions 2012 2011 Expense 2012 2011 2012 Life(1)
Software support agreements and related relationships ........... $ 5,177 $ 117 $ 5,294 $ (2,745) $ (585) $ (3,330) $ 2,432 $ 1,964 8 years
Hardware systems support agreements and related relationships .... 760 8 768 (147) (119) (266) 613 502 8 years
Developed technology ..................................... 6,034 874 6,908 (3,728) (923) (4,651) 2,306 2,257 7 years
Core technology ......................................... 2,295 254 2,549 (1,272) (337) (1,609) 1,023 940 6 years
Customer relationships and contract backlog ................... 1,935 325 2,260 (917) (370) (1,287) 1,018 973 3 years
Cloud software subscriptions and related relationships ........... 128 861 989 (9) (33) (42) 119 947 10 years
Trademarks ............................................. 528 69 597 (229) (63) (292) 299 305 9 years
Total intangible assets subject to amortization .............. 16,857 2,508 19,365 (9,047) (2,430) (11,477) 7,810 7,888 8 years
In-process research and development ......................... 50 (39) 11 — — — 50 11 N.A.
Total intangible assets, net ............................. $ 16,907 $ 2,469 $ 19,376 $ (9,047) $ (2,430) $ (11,477) $ 7,860 $ 7,899
(1) Represents weighted average useful lives of intangible assets acquired in fiscal 2012.
Total amortization expense related to our intangible assets was $2.4 billion in each of fiscal 2012 and 2011 and
$2.0 billion in fiscal 2010. As of May 31, 2012, estimated future amortization expenses related to intangible
assets were as follows (in millions):
Fiscal 2013 ........................................................................ $ 2,313
Fiscal 2014 ........................................................................ 1,938
Fiscal 2015 ........................................................................ 1,488
Fiscal 2016 ........................................................................ 941
Fiscal 2017 ........................................................................ 384
Thereafter ......................................................................... 824
Total intangible assets subject to amortization ........................................ 7,888
In-process research and development ................................................... 11
Total intangible assets, net ........................................................ $ 7,899
105