Oracle 2012 Annual Report Download - page 61
Download and view the complete annual report
Please find page 61 of the 2012 Oracle annual report below. You can navigate through the pages in the report by either clicking on the pages listed below, or by using the keyword search tool below to find specific information within the annual report.-
 1
1 -
2
-
3
-
4
-
5
-
6
-
7
-
8
-
9
-
10
-
11
-
12
-
13
-
14
-
15
-
16
-
17
-
18
-
19
-
20
-
21
-
22
-
23
-
24
-
25
-
26
-
27
-
28
-
29
-
30
-
31
-
32
-
33
-
34
-
35
-
36
-
37
-
38
-
39
-
40
-
41
-
42
-
43
-
44
-
45
-
46
-
47
-
48
-
49
-
50
-
 51
51 -
 52
52 -
 53
53 -
 54
54 -
 55
55 -
 56
56 -
 57
57 -
 58
58 -
 59
59 -
 60
60 -
 61
61 -
 62
62 -
 63
63 -
 64
64 -
 65
65 -
 66
66 -
 67
67 -
 68
68 -
 69
69 -
 70
70 -
 71
71 -
72
-
73
-
74
-
75
-
76
-
77
-
78
-
79
-
80
-
81
-
82
-
83
-
84
-
85
-
86
-
87
-
88
-
89
-
90
-
91
-
92
-
93
-
94
-
95
-
96
-
97
-
98
-
99
-
100
-
101
-
102
-
103
-
104
-
105
-
106
-
107
-
108
-
109
-
110
-
111
-
112
-
113
-
114
-
115
-
116
-
117
-
118
-
119
-
120
-
121
-
122
-
123
-
124
-
125
-
126
-
127
-
128
-
129
-
130
-
131
-
132
-
133
-
134
-
135
-
136
-
137
-
138
-
139
-
140
 |
 |

(5) The significant majority of restructuring expenses during fiscal 2012 and fiscal 2011 relate to employee severance, facility exit costs and
contract termination costs in connection with our Sun Restructuring Plan. Restructuring expenses during fiscal 2010 primarily relate to
costs incurred pursuant to our Sun Restructuring Plan and our Fiscal 2009 Oracle Restructuring Plan. Additional information regarding
certain of our restructuring plans is provided in Note 9 of Notes to Consolidated Financial Statements included elsewhere in this Annual
Report.
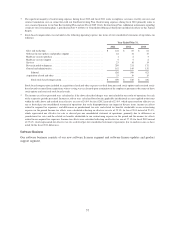
(6) Stock-based compensation was included in the following operating expense line items of our consolidated statements of operations (in
millions):
Year Ended May 31,
2012 2011 2010
Sales and marketing ................................................ $ 122 $ 87 $ 81
Software license updates and product support ............................ 18 14 17
Hardware systems products .......................................... 1 2 3
Hardware systems support ........................................... 5 5 2
Services ......................................................... 23 16 14
Research and development ........................................... 295 231 172
General and administrative ........................................... 162 145 132
Subtotal ...................................................... 626 500 421
Acquisition related and other ......................................... 33 10 15
Total stock-based compensation ................................... $ 659 $ 510 $ 436
Stock-based compensation included in acquisition related and other expenses resulted from unvested stock options and restricted stock-
based awards assumed from acquisitions whose vesting was accelerated upon termination of the employees pursuant to the terms of those
stock options and restricted stock-based awards.
(7) The income tax effects presented were calculated as if the above described charges were not included in our results of operations for each
of the respective periods presented. Income tax effects were calculated based on the applicable jurisdictional tax rates applied to the items
within the table above and resulted in an effective tax rate of 24.0% for fiscal 2012 instead of 23.0%, which represented our effective tax
rate as derived per our consolidated statement of operations, due to the disproportionate rate impact of discrete items, income tax effects
related to acquired tax exposures, and differences in jurisdictional tax rates and related tax benefits attributable to our restructuring
expenses in the period. Income tax effects were calculated reflecting an effective tax rate of 25.3% for fiscal 2011 instead of 25.1%,
which represented our effective tax rate as derived per our consolidated statement of operations, primarily due to differences in
jurisdictional tax rates and the related tax benefits attributable to our restructuring expenses in the period and the income tax effects
related to our acquired tax exposures. Income tax effects were calculated reflecting an effective tax rate of 27.1% for fiscal 2010 instead
of 25.6%, which represented our effective tax rate as derived per our consolidated statement of operations, due to similar reasons as those
noted for the fiscal 2011 differences.
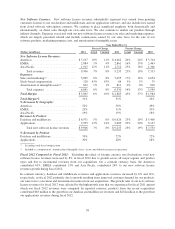
Software Business
Our software business consists of our new software licenses segment and software license updates and product
support segment.
57