Oracle 2012 Annual Report Download - page 75
Download and view the complete annual report
Please find page 75 of the 2012 Oracle annual report below. You can navigate through the pages in the report by either clicking on the pages listed below, or by using the keyword search tool below to find specific information within the annual report.-
 1
1 -
2
-
3
-
4
-
5
-
6
-
7
-
8
-
9
-
10
-
11
-
12
-
13
-
14
-
15
-
16
-
17
-
18
-
19
-
20
-
21
-
22
-
23
-
24
-
25
-
26
-
27
-
28
-
29
-
30
-
31
-
32
-
33
-
34
-
35
-
36
-
37
-
38
-
39
-
40
-
41
-
42
-
43
-
44
-
45
-
46
-
47
-
48
-
49
-
50
-
51
-
52
-
53
-
54
-
55
-
56
-
57
-
58
-
59
-
60
-
61
-
62
-
63
-
64
-
 65
65 -
 66
66 -
 67
67 -
 68
68 -
 69
69 -
 70
70 -
 71
71 -
 72
72 -
 73
73 -
 74
74 -
 75
75 -
 76
76 -
 77
77 -
 78
78 -
 79
79 -
 80
80 -
 81
81 -
 82
82 -
 83
83 -
 84
84 -
 85
85 -
86
-
87
-
88
-
89
-
90
-
91
-
92
-
93
-
94
-
95
-
96
-
97
-
98
-
99
-
100
-
101
-
102
-
103
-
104
-
105
-
106
-
107
-
108
-
109
-
110
-
111
-
112
-
113
-
114
-
115
-
116
-
117
-
118
-
119
-
120
-
121
-
122
-
123
-
124
-
125
-
126
-
127
-
128
-
129
-
130
-
131
-
132
-
133
-
134
-
135
-
136
-
137
-
138
-
139
-
140
 |
 |

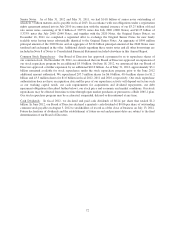
Fiscal 2011 Compared to Fiscal 2010: Net cash provided by financing activities in fiscal 2011 decreased due
to a reduction in the amount of debt that we issued in fiscal 2011 ($1.15 billion borrowed pursuant to our
revolving credit facilities and $3.25 billion of long-term senior notes issued) in comparison to fiscal 2010 ($4.5
billion of long-term senior notes and $2.8 billion of commercial paper notes issued). This unfavorable impact to
our financing cash flows was partially offset by a cash favorable reduction in debt repayments during fiscal 2011
(repayments of $2.25 billion of senior notes in January 2011 and $881 million of commercial paper notes) in
comparison to fiscal 2010 (repayments of $1.9 billion of commercial paper notes, $1.0 billion of floating rate
senior notes and $700 million of Sun’s legacy convertible notes) and an increase in proceeds from stock option
exercises during fiscal 2011.
Free cash flow: To supplement our statements of cash flows presented on a GAAP basis, we use non-GAAP
measures of cash flows on a trailing 4-quarter basis to analyze cash flows generated from our operations. We
believe free cash flow is also useful as one of the bases for comparing our performance with our competitors. The
presentation of non-GAAP free cash flow is not meant to be considered in isolation or as an alternative to net
income as an indicator of our performance, or as an alternative to cash flows from operating activities as a
measure of liquidity. We calculate free cash flows as follows:
Year Ended May 31,
(Dollars in millions) 2012 Change 2011 Change 2010
Net cash provided by operating activities ................ $ 13,743 23% $ 11,214 29% $ 8,681
Capital expenditures(1) ............................... (648) 44% (450) 96% (230)
Free cash flow ..................................... $ 13,095 22% $ 10,764 27% $ 8,451
Net income ....................................... $ 9,981 $ 8,547 39% $ 6,135
Free cash flow as percent of net income ................. 131% 126% 138%
(1) Represents capital expenditures as reported in cash flows from investing activities in our consolidated statements of cash flows presented
in accordance with U.S. generally accepted accounting principles.
Long-Term Customer Financing: We offer certain of our customers the option to acquire our software
products, hardware systems products and services offerings through separate long-term payment contracts. We
generally sell these contracts that we have financed on a non-recourse basis to financial institutions within 90
days of the contracts’ dates of execution. We record the transfers of amounts due from customers to financial
institutions as sales of financial assets because we are considered to have surrendered control of these financial
assets. We financed $1.6 billion, $1.5 billion and $1.2 billion, respectively, or approximately 16% of our new
software license revenues in each of fiscal 2012, 2011 and 2010, and $134 million and $117 million,
respectively, or approximately 3% of our hardware systems products revenues in each of fiscal 2012 and 2011.
Recent Financing Activities:
Revolving Credit Agreement: On May 29, 2012, we borrowed $1.7 billion pursuant to a revolving credit
agreement with JPMorgan Chase Bank, N.A., as initial lender and administrative agent; and J.P. Morgan
Securities, LLC, as sole lead arranger and sole bookrunner (the 2012 Credit Agreement). Interest for the 2012
Credit Agreement is based on either (x) a “base rate” calculated as the highest of (i) JPMorgan’s prime rate,
(ii) the federal funds effective rate plus 0.50% and (iii) the LIBOR for deposits in U.S. Dollars plus 1%, or
(y) LIBOR for deposits made in U.S. Dollars plus 0.35%, depending on the type of borrowings made by us. This
borrowing is due on July 2, 2012, which is the termination date of the 2012 Credit Agreement. Additional details
regarding the 2012 Credit Agreement are included in Note 8 of Notes to Consolidated Financial Statements
included elsewhere in this Annual Report.
On June 30, 2011, our revolving credit agreements with BNP Paribas, as initial lender and administrative agent,
and BNP Paribas Securities Corp., as sole lead arranger and sole bookrunner (the 2011 Credit Agreements), to
borrow $1.15 billion were repaid in full and the 2011 Credit Agreements expired pursuant to their terms.
RightNow Convertible Notes: Subsequent to the closing of our acquisition of RightNow, we repaid, in full,
$255 million of RightNow’s legacy convertible notes during the third quarter of fiscal 2012.
71