Motorola 2007 Annual Report Download - page 94
Download and view the complete annual report
Please find page 94 of the 2007 Motorola annual report below. You can navigate through the pages in the report by either clicking on the pages listed below, or by using the keyword search tool below to find specific information within the annual report.-
 1
1 -
2
-
3
-
4
-
5
-
6
-
7
-
8
-
9
-
10
-
11
-
12
-
13
-
14
-
15
-
16
-
17
-
18
-
19
-
20
-
21
-
22
-
23
-
24
-
25
-
26
-
27
-
28
-
29
-
30
-
31
-
32
-
33
-
34
-
35
-
36
-
37
-
38
-
39
-
40
-
41
-
42
-
43
-
44
-
45
-
46
-
47
-
48
-
49
-
50
-
51
-
52
-
53
-
54
-
55
-
56
-
57
-
58
-
59
-
60
-
61
-
62
-
63
-
64
-
65
-
66
-
67
-
68
-
69
-
70
-
71
-
72
-
73
-
74
-
75
-
76
-
77
-
78
-
79
-
80
-
81
-
82
-
83
-
 84
84 -
 85
85 -
 86
86 -
 87
87 -
 88
88 -
 89
89 -
 90
90 -
 91
91 -
 92
92 -
 93
93 -
 94
94 -
 95
95 -
 96
96 -
 97
97 -
 98
98 -
 99
99 -
 100
100 -
 101
101 -
 102
102 -
 103
103 -
 104
104 -
105
-
106
-
107
-
108
-
109
-
110
-
111
-
112
-
113
-
114
-
115
-
116
-
117
-
118
-
119
-
120
-
121
-
122
-
123
-
124
-
125
-
126
-
127
-
128
-
129
-
130
-
131
-
132
-
133
-
134
-
135
-
136
-
137
-
138
-
139
-
140
-
141
-
142
-
143
-
144
-
145
-
146
 |
 |

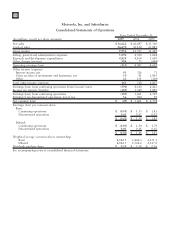
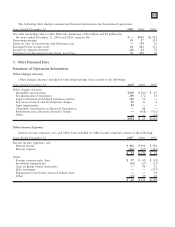
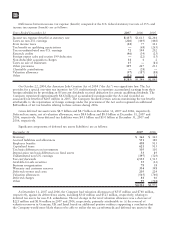
Earnings (Loss) Per Common Share
Basic and diluted earnings (loss) per common share from both continuing operations and net earnings (loss),
which includes discontinued operations, is computed as follows:
Years Ended December 31 2007 2006 2005 2007 2006 2005
Continuing Operations Net Earnings (Loss)
Basic earnings (loss) per common share:
Earnings (loss) $ (105) $ 3,261 $ 4,519 $ (49) $ 3,661 $ 4,578
Weighted average common shares outstanding 2,312.7 2,446.3 2,471.3 2,312.7 2,446.3 2,471.3
Per share amount $ (0.05) $ 1.33 $ 1.83 $ (0.02) $ 1.50 $ 1.85
Diluted earnings (loss) per common share:
Earnings (loss) $ (105) $ 3,261 $ 4,519 $ (49) $ 3,661 $ 4,578
Weighted average common shares outstanding 2,312.7 2,446.3 2,471.3 2,312.7 2,446.3 2,471.3
Add effect of dilutive securities:
Employee share-based awards —57.9 55.7 —57.9 55.7
Diluted weighted average common shares outstanding 2,312.7 2,504.2 2,527.0 2,312.7 2,504.2 2,527.0
Per share amount $ (0.05) $ 1.30 $ 1.79 $ (0.02) $ 1.46 $ 1.81
In the computation of diluted earnings (loss) per common share from both continuing operations and on a net
earnings (loss) basis for the years ended December 31, 2007, 2006 and 2005 the assumed exercise of 108.4
million, 76.6 million and 44.8 million stock options, respectively, were excluded because their inclusion would
have been antidilutive.
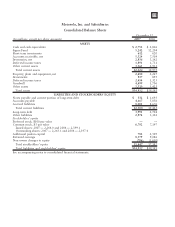
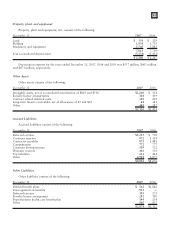
Balance Sheet Information
Sigma Fund and Investments
Sigma Fund and Investments consist of the following:
Years Ended December 31
Sigma
Fund
Short-term
Investments Investments
Unrealized
Gains
Unrealized
Losses
Cost
Basis
Fair Value Less
2007
Available-for-sale securities:
Cash $16 $— $— $— $ — $ 16
Certificates of deposit 156 509 — — — 665
Commercial paper 1,282 — — — — 1,282
Government and agencies 25 19 — — — 44
Corporate bonds 3,125 1 — 1 (48) 3,173
Asset-backed securities 420 — — — (5) 425
Mortgage-backed securities 209 — — — (5) 214
Common stock and equivalents —— 333 40 (79) 372
Other 983 — — — 92
5,242 612 333 41 (137) 6,283
Other securities, at cost —— 414 — — 414
Equity method investments ——90— —90
$5,242 $612 $837 $41 $(137) $6,787
86