Motorola 2007 Annual Report Download - page 49
Download and view the complete annual report
Please find page 49 of the 2007 Motorola annual report below. You can navigate through the pages in the report by either clicking on the pages listed below, or by using the keyword search tool below to find specific information within the annual report.-
 1
1 -
2
-
3
-
4
-
5
-
6
-
7
-
8
-
9
-
10
-
11
-
12
-
13
-
14
-
15
-
16
-
17
-
18
-
19
-
20
-
21
-
22
-
23
-
24
-
25
-
26
-
27
-
28
-
29
-
30
-
31
-
32
-
33
-
34
-
35
-
36
-
37
-
38
-
 39
39 -
 40
40 -
 41
41 -
 42
42 -
 43
43 -
 44
44 -
 45
45 -
 46
46 -
 47
47 -
 48
48 -
 49
49 -
 50
50 -
 51
51 -
 52
52 -
 53
53 -
 54
54 -
 55
55 -
 56
56 -
 57
57 -
 58
58 -
 59
59 -
60
-
61
-
62
-
63
-
64
-
65
-
66
-
67
-
68
-
69
-
70
-
71
-
72
-
73
-
74
-
75
-
76
-
77
-
78
-
79
-
80
-
81
-
82
-
83
-
84
-
85
-
86
-
87
-
88
-
89
-
90
-
91
-
92
-
93
-
94
-
95
-
96
-
97
-
98
-
99
-
100
-
101
-
102
-
103
-
104
-
105
-
106
-
107
-
108
-
109
-
110
-
111
-
112
-
113
-
114
-
115
-
116
-
117
-
118
-
119
-
120
-
121
-
122
-
123
-
124
-
125
-
126
-
127
-
128
-
129
-
130
-
131
-
132
-
133
-
134
-
135
-
136
-
137
-
138
-
139
-
140
-
141
-
142
-
143
-
144
-
145
-
146
 |
 |

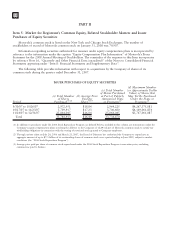
We conduct our business in highly competitive markets, facing both new and established competitors. The
markets for many of our products are characterized by rapidly changing technologies, frequent new product
introductions, changing consumer trends, short product life cycles and evolving industry standards. Market
disruptions caused by new technologies, the entry of new competitors into markets we serve, and frequent
consolidations among our customers and competitors, among other matters, can introduce volatility into our
operating performance and cash flow from operations. And as we enter 2008, we face a very dynamic economic
environment. Meeting all of these challenges requires consistent operational planning and execution and
investment in technology, resulting in innovative products that meet the expanding needs of our customers around
the world. As we execute on meeting these objectives, our overall strategy remains unchanged — to focus our
efforts on the convergence of fixed and wireless broadband internet and growing demand for next generation
wireless communications solutions by people, businesses and governments. We will continue to take the necessary
strategic actions to enable these efforts, to provide for growth and improved profitability and position Motorola
for future success.
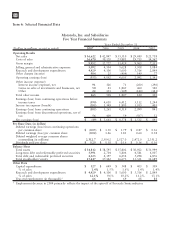
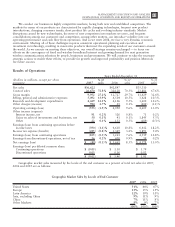
Results of Operations
(Dollars in millions, except per share
amounts) 2007 %of
sales 2006 %of
sales 2005 %of
sales
Years Ended December 31
Net sales $36,622 $42,847 $35,310
Costs of sales 26,670 72.8% 30,120 70.3% 23,881 67.6%
Gross margin 9,952 27.2% 12,727 29.7% 11,429 32.4%
Selling, general and administrative expenses 5,092 13.9% 4,504 10.5% 3,628 10.3%
Research and development expenditures 4,429 12.1% 4,106 9.5% 3,600 10.2%
Other charges (income) 984 2.7% 25 0.1% (404) (1.1)%
Operating earnings (loss) (553) (1.5)% 4,092 9.6% 4,605 13.0%
Other income (expense):
Interest income, net 91 0.2% 326 0.8% 71 0.2%
Gains on sales of investments and businesses, net 50 0.1% 41 0.1% 1,845 5.3%
Other 22 0.1% 151 0.3% (109) (0.3)%
Earnings (loss) from continuing operations before
income taxes (390) (1.1)% 4,610 10.8% 6,412 18.2%
Income tax expense (benefit) (285) (0.8)% 1,349 3.2% 1,893 5.4%
Earnings (loss) from continuing operations (105) (0.3)% 3,261 7.6% 4,519 12.8%
Earnings from discontinued operations, net of tax 56 0.2% 400 0.9% 59 0.2%
Net earnings (loss) $ (49) (0.1)% $ 3,661 8.5% $ 4,578 13.0%
Earnings (loss) per diluted common share:
Continuing operations $ (0.05) $ 1.30 $ 1.79
Discontinued operations 0.03 0.16 0.02
$ (0.02) $ 1.46 $ 1.81
Geographic market sales measured by the locale of the end customer as a percent of total net sales for 2007,
2006 and 2005 are as follows:
Geographic Market Sales by Locale of End Customer
2007 2006 2005
United States 51% 44% 47%
Europe 13% 15% 19%
Latin America 12% 10% 10%
Asia, excluding China 9% 11% 9%
China 7% 11% 8%
Other Markets 8% 9% 7%
100% 100% 100%
41
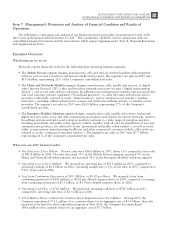
MANAGEMENT’S DISCUSSION AND ANALYSIS
OF FINANCIAL CONDITION AND RESULTS OF OPERATIONS