Motorola 2007 Annual Report Download - page 129
Download and view the complete annual report
Please find page 129 of the 2007 Motorola annual report below. You can navigate through the pages in the report by either clicking on the pages listed below, or by using the keyword search tool below to find specific information within the annual report.-
 1
1 -
2
-
3
-
4
-
5
-
6
-
7
-
8
-
9
-
10
-
11
-
12
-
13
-
14
-
15
-
16
-
17
-
18
-
19
-
20
-
21
-
22
-
23
-
24
-
25
-
26
-
27
-
28
-
29
-
30
-
31
-
32
-
33
-
34
-
35
-
36
-
37
-
38
-
39
-
40
-
41
-
42
-
43
-
44
-
45
-
46
-
47
-
48
-
49
-
50
-
51
-
52
-
53
-
54
-
55
-
56
-
57
-
58
-
59
-
60
-
61
-
62
-
63
-
64
-
65
-
66
-
67
-
68
-
69
-
70
-
71
-
72
-
73
-
74
-
75
-
76
-
77
-
78
-
79
-
80
-
81
-
82
-
83
-
84
-
85
-
86
-
87
-
88
-
89
-
90
-
91
-
92
-
93
-
94
-
95
-
96
-
97
-
98
-
99
-
100
-
101
-
102
-
103
-
104
-
105
-
106
-
107
-
108
-
109
-
110
-
111
-
112
-
113
-
114
-
115
-
116
-
117
-
118
-
 119
119 -
 120
120 -
 121
121 -
 122
122 -
 123
123 -
 124
124 -
 125
125 -
 126
126 -
 127
127 -
 128
128 -
 129
129 -
 130
130 -
 131
131 -
 132
132 -
 133
133 -
 134
134 -
 135
135 -
 136
136 -
 137
137 -
 138
138 -
 139
139 -
140
-
141
-
142
-
143
-
144
-
145
-
146
 |
 |

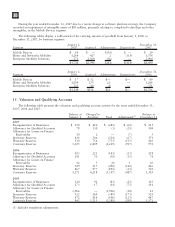
16. Quarterly and Other Financial Data (unaudited)*
1st 2nd 3rd 4th 1st 2nd 3rd 4th
2007 2006
Operating Results
Net sales $9,433 $8,732 $8,811 $9,646 $9,632 $10,820 $10,603 $11,792
Costs of sales 6,979 6,279 6,306 7,106 6,701 7,463 7,233 8,723
Gross margin 2,454 2,453 2,505 2,540 2,931 3,357 3,370 3,069
Selling, general and administrative
expenses 1,313 1,296 1,210 1,273 1,069 1,154 1,123 1,158
Research and development
expenditures 1,117 1,115 1,100 1,097 964 1,035 1,046 1,061
Other charges (income) 390 200 205 189 49 (354) 233 97
Operating earnings (loss) (366) (158) (10) (19) 849 1,522 968 753
Earnings (loss) from continuing
operations (218) (38) 40 111 656 1,349 727 529
Net earnings (loss) (181) (28) 60 100 686 1,384 968 623
Per Share Data (in dollars)
Continuing Operations:
Basic earnings (loss) per common share $ (0.09) $ (0.02) $ 0.02 $ 0.05 $ 0.26 $ 0.55 $ 0.30 $ 0.22
Diluted earnings (loss) per common
share (0.09) (0.02) 0.02 0.05 0.26 0.54 0.29 0.21
Net Earnings:
Basic earnings (loss) per common share (0.08) (0.01) 0.03 0.04 0.28 0.56 0.40 0.26
Diluted earnings (loss) per common
share (0.08) (0.01) 0.03 0.04 0.27 0.55 0.39 0.25
Dividends declared 0.05 0.05 0.05 0.05 0.04 0.05 0.05 0.05
Dividends paid 0.05 0.05 0.05 0.05 0.04 0.04 0.05 0.05
Stock prices
High 20.91 19.18 18.88 19.68 24.67 24.24 25.55 26.30
Low 17.45 17.32 15.61 14.87 20.22 19.01 18.66 20.17
* Certain amounts in prior years’ financial statements and related notes have been reclassified to conform to the
2007 presentation.
121