Motorola 2007 Annual Report Download - page 69
Download and view the complete annual report
Please find page 69 of the 2007 Motorola annual report below. You can navigate through the pages in the report by either clicking on the pages listed below, or by using the keyword search tool below to find specific information within the annual report.-
 1
1 -
2
-
3
-
4
-
5
-
6
-
7
-
8
-
9
-
10
-
11
-
12
-
13
-
14
-
15
-
16
-
17
-
18
-
19
-
20
-
21
-
22
-
23
-
24
-
25
-
26
-
27
-
28
-
29
-
30
-
31
-
32
-
33
-
34
-
35
-
36
-
37
-
38
-
39
-
40
-
41
-
42
-
43
-
44
-
45
-
46
-
47
-
48
-
49
-
50
-
51
-
52
-
53
-
54
-
55
-
56
-
57
-
58
-
 59
59 -
 60
60 -
 61
61 -
 62
62 -
 63
63 -
 64
64 -
 65
65 -
 66
66 -
 67
67 -
 68
68 -
 69
69 -
 70
70 -
 71
71 -
 72
72 -
 73
73 -
 74
74 -
 75
75 -
 76
76 -
 77
77 -
 78
78 -
 79
79 -
80
-
81
-
82
-
83
-
84
-
85
-
86
-
87
-
88
-
89
-
90
-
91
-
92
-
93
-
94
-
95
-
96
-
97
-
98
-
99
-
100
-
101
-
102
-
103
-
104
-
105
-
106
-
107
-
108
-
109
-
110
-
111
-
112
-
113
-
114
-
115
-
116
-
117
-
118
-
119
-
120
-
121
-
122
-
123
-
124
-
125
-
126
-
127
-
128
-
129
-
130
-
131
-
132
-
133
-
134
-
135
-
136
-
137
-
138
-
139
-
140
-
141
-
142
-
143
-
144
-
145
-
146
 |
 |

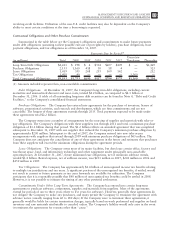
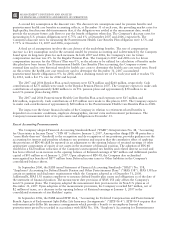
The segment reported operating earnings of $709 million in 2007, compared to operating earnings of
$787 million in 2006. The decrease in operating earnings was primarily due to a decrease in gross margin, driven
by: (i) lower net sales of iDEN infrastructure equipment, and (ii) continued competitive pricing pressure in the
market for GSM infrastructure equipment, partially offset by: (i) increased net sales of digital entertainment
devices, and (ii) the reversal of reorganization of business accruals recorded in 2006 relating to employee severance
which are no longer needed. SG&A expenses increased primarily due to the expenses from recently acquired
businesses, partially offset by savings from cost-reduction initiatives. R&D expenditures decreased primarily due to
savings from cost-reduction initiatives, partially offset by expenditures by recently acquired businesses and
continued investment in digital entertainment devices and WiMAX. As a percentage of net sales in 2007 as
compared to 2006, gross margin, SG&A expenses, R&D expenditures and operating margin all decreased. The
segment’s gross margin percentages differ among its services, software and equipment products. Accordingly, the
aggregate gross margin of the segment can fluctuate from period to period depending upon the relative mix of sales
in the given period.
Due to the nature of the segment’s business, many of the agreements we enter into are long-term contracts
that require sizeable investments by our customers. The segment is dependent upon a small number of customers
for a significant portion of its sales. A small number of large cable television multiple system operators (“MSOs”)
own a large portion of the cable systems and account for a significant portion of the total capital spending in the
cable industry. In 2007, sales to our top five customers (Comcast; Verizon; KDDI, a service provider in Japan;
China Mobile; and Sprint Nextel) represented approximately 43% of the segments net sales. The loss of one of
these major customers could have a significant impact on the segment’s business and, because many of these
contracts are long-term in nature, could impact revenue and earnings over several quarters. The segment’s backlog
was $2.6 billion at December 31, 2007, compared to $3.2 billion at December 31, 2006.
In the home business, demand for the segment’s products depends primarily on the level of capital spending by
broadband operators for constructing, rebuilding or upgrading their communications systems, and for offering
advanced services. During the second quarter of 2007, the segment began shipping digital set-tops that support the
Federal Communications Commission (“FCC”)—mandated separable security requirement. FCC regulations
mandating the separation of security functionality from set-tops went into effect on July 1, 2007. As a result of
these regulations, many cable service providers accelerated their purchases of set-tops in the first half of 2007.
Additionally, in 2007, our digital video customers significantly increased their purchases of the segment’s products
and services, primarily due to increased demand for digital video set-tops, particularly HD/DVR set-tops.
In the wireless networks business, the segment has been a long-standing proponent of WiMAX and is now
participating in over 40 WiMAX trials globally and several commercial contracts globally. The segment also
maintained momentum in infrastructure development and services in 2007 by continuing to deliver outstanding
technologies and services for wireless and wireline carriers.
During 2007, the segment completed the acquisitions of: (i) Netopia, Inc., a broadband equipment provider
for DSL customers, which allows for phone, TV and fast Internet connections, (ii) Tut Systems, Inc., a leading
developer of edge routing and video encoders, (iii) Modulus Video, Inc., a provider of MPEG-4 Advanced Coding
compression systems designed for delivery of high-value video content in IP set-top devices for the digital video,
broadcast and satellite marketplaces, (iv) Terayon Communication Systems, Inc., a provider of real-time digital
video networking applications to cable, satellite and telecommunication service providers worldwide, and
(v) Leapstone Systems, Inc., a provider of intelligent multimedia service delivery and content management solutions
to networks operators. These acquisitions enhance our ability to provide a complete end-to-end solution for the
delivery of advanced video, voice and data services. In December 2007, Motorola completed the sale of its
embedded communication computing business to Emerson for $346 million in cash.
Segment Results—2006 Compared to 2005
In 2006, the segment’s net sales increased 1% to $9.2 billion, compared to $9.0 billion in 2005. The 1%
increase in net sales reflected a 16% increase in net sales in the home business, partially offset by a 5%
decrease in net sales of wireless networks. Net sales of digital entertainment devices increased approximately
24%, reflecting increased demand for HD/DVR set-tops, partially offset by a decline in ASP due to a product
mix shift. Unit shipments of digital entertainment devices increased 57% to 10.1 million units. Net sales of
broadband gateways increased approximately 18%, primarily due to: (i) increased unit shipments of cable
modems, and (ii) increased ASPs for cable modems, reflecting increased demand for advanced voice-enabled
modems. Net sales of wireless networks decreased 5%, primarily driven by lower demand for GSM, iDEN and
CDMA infrastructure equipment.
61
MANAGEMENT’S DISCUSSION AND ANALYSIS
OF FINANCIAL CONDITION AND RESULTS OF OPERATIONS