Motorola 2007 Annual Report Download - page 52
Download and view the complete annual report
Please find page 52 of the 2007 Motorola annual report below. You can navigate through the pages in the report by either clicking on the pages listed below, or by using the keyword search tool below to find specific information within the annual report.-
 1
1 -
2
-
3
-
4
-
5
-
6
-
7
-
8
-
9
-
10
-
11
-
12
-
13
-
14
-
15
-
16
-
17
-
18
-
19
-
20
-
21
-
22
-
23
-
24
-
25
-
26
-
27
-
28
-
29
-
30
-
31
-
32
-
33
-
34
-
35
-
36
-
37
-
38
-
39
-
40
-
41
-
 42
42 -
 43
43 -
 44
44 -
 45
45 -
 46
46 -
 47
47 -
 48
48 -
 49
49 -
 50
50 -
 51
51 -
 52
52 -
 53
53 -
 54
54 -
 55
55 -
 56
56 -
 57
57 -
 58
58 -
 59
59 -
 60
60 -
 61
61 -
 62
62 -
63
-
64
-
65
-
66
-
67
-
68
-
69
-
70
-
71
-
72
-
73
-
74
-
75
-
76
-
77
-
78
-
79
-
80
-
81
-
82
-
83
-
84
-
85
-
86
-
87
-
88
-
89
-
90
-
91
-
92
-
93
-
94
-
95
-
96
-
97
-
98
-
99
-
100
-
101
-
102
-
103
-
104
-
105
-
106
-
107
-
108
-
109
-
110
-
111
-
112
-
113
-
114
-
115
-
116
-
117
-
118
-
119
-
120
-
121
-
122
-
123
-
124
-
125
-
126
-
127
-
128
-
129
-
130
-
131
-
132
-
133
-
134
-
135
-
136
-
137
-
138
-
139
-
140
-
141
-
142
-
143
-
144
-
145
-
146
 |
 |

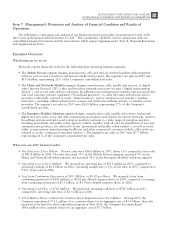
repatriations, (iii) favorable tax settlements reached with foreign jurisdictions, (iv) tax benefits for foreign earnings
permanently reinvested, (v) contribution of appreciated investments to the Company’s charitable foundation and
unfavorably impacted by: (i) the incurrence of non-deductible IPR&D charges, and (ii) restructuring charges in low
tax jurisdictions. The effective tax rate for 2006 excluding these items was 36%.
The effective tax rate for continuing operations excluding identified items of 26% for 2007 is less than the
comparable effective tax rate of 36% for 2006 due to an increase in tax credits in 2007 compared to 2006 and a
change in the mix of income and loss by region. In 2008, the Company currently expects the effective tax rate for
continuing operations, excluding items of the type identified above, to be approximately 35%.
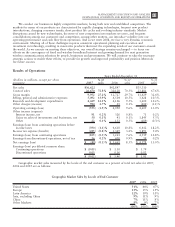
Earnings (Loss) from Continuing Operations
The Company incurred a net loss from continuing operations before income taxes of $390 million in 2007,
compared to earnings from continuing operations before income taxes of $4.6 billion in 2006. After taxes, the
Company incurred a loss from continuing operations of $105 million, or $0.05 per diluted share, in 2007,
compared to earnings from continuing operations of $3.3 billion, or $1.30 per diluted share, in 2006.
The decrease in earnings (loss) from continuing operations before income taxes in 2007 compared to 2006 is
primarily attributed to: (i) a $2.8 billion decrease in gross margin, driven by decreases in gross margin in the
Mobile Devices and Home and Network Mobility segments, partially offset by an increase in gross margin in the
Enterprise Mobility Solutions segment, (ii) a $959 million increase in Other charges (income), (iii) a $588 million
increase in SG&A expenses, (iv) a $323 million increase in R&D expenditures, (v) a $235 million decrease in net
interest income, and (vi) a $129 million decrease in income classified as Other, as presented in Other income
(expense).
Results of Operations—2006 Compared to 2005
Net Sales
Net sales were $42.8 billion in 2006, up 21% compared to net sales of $35.3 billion in 2005. The increase in
net sales included: (i) a $6.9 billion increase in net sales by the Mobile Devices segment driven by a 49% increase
in unit shipments, reflecting strong demand for GSM and CDMA handsets, partially offset by an 11% decline in
average selling price (“ASP”), (ii) a $362 million increase in net sales by the Enterprise Mobility Solutions segment,
primarily due to higher net sales in the government and public safety market, and (iii) a $127 million increase in
net sales by the Home and Networks Mobility segment, primarily driven by a 57% increase in unit shipments of
digital entertainment devices, partially offset by lower net sales of wireless networks.
Gross Margin
Gross margin was $12.7 billion, or 29.7% of net sales, in 2006, compared to $11.4 billion, or 32.4% of net
sales, in 2005. This increase in gross margin was primarily driven by the Mobile Devices segment, due to: (i) the
49% increase in unit shipments, (ii) savings from supply chain cost-reduction initiatives, and (iii) increased income
from intellectual property and technology licensing, partially offset by an 11% decline in ASP. The Enterprise
Mobility Solutions segment also achieved higher gross margin in 2006 compared to 2005, primarily driven by a
7% increase in net sales. The Home and Networks Mobility Solutions segment had lower gross margin in 2006
compared to 2005, primarily due to an unfavorable product/regional mix and competitive pricing in the wireless
networks market, partially offset by higher gross margin in the home business.
Gross margin as a percentage of net sales decreased in 2006 compared to 2005, driven by decreases in the
Mobile Devices and Home and Networks Mobility segments, partially offset by an increase in the Enterprise
Mobility Solutions segment. The Company’s overall gross margin as a percentage of net sales can be impacted by
the proportion of overall net sales generated by its various businesses. The decrease in overall gross margin as a
percentage of net sales in 2006 compared to 2005 can be partially attributed to the fact that an increased
percentage of the Company’s net sales were generated by the Mobile Devices segment in 2006, which generates
lower gross margins than the overall Company average.
44 MANAGEMENT’S DISCUSSION AND ANALYSIS
OF FINANCIAL CONDITION AND RESULTS OF OPERATIONS