Motorola 2007 Annual Report Download - page 68
Download and view the complete annual report
Please find page 68 of the 2007 Motorola annual report below. You can navigate through the pages in the report by either clicking on the pages listed below, or by using the keyword search tool below to find specific information within the annual report.-
 1
1 -
2
-
3
-
4
-
5
-
6
-
7
-
8
-
9
-
10
-
11
-
12
-
13
-
14
-
15
-
16
-
17
-
18
-
19
-
20
-
21
-
22
-
23
-
24
-
25
-
26
-
27
-
28
-
29
-
30
-
31
-
32
-
33
-
34
-
35
-
36
-
37
-
38
-
39
-
40
-
41
-
42
-
43
-
44
-
45
-
46
-
47
-
48
-
49
-
50
-
51
-
52
-
53
-
54
-
55
-
56
-
57
-
 58
58 -
 59
59 -
 60
60 -
 61
61 -
 62
62 -
 63
63 -
 64
64 -
 65
65 -
 66
66 -
 67
67 -
 68
68 -
 69
69 -
 70
70 -
 71
71 -
 72
72 -
 73
73 -
 74
74 -
 75
75 -
 76
76 -
 77
77 -
 78
78 -
79
-
80
-
81
-
82
-
83
-
84
-
85
-
86
-
87
-
88
-
89
-
90
-
91
-
92
-
93
-
94
-
95
-
96
-
97
-
98
-
99
-
100
-
101
-
102
-
103
-
104
-
105
-
106
-
107
-
108
-
109
-
110
-
111
-
112
-
113
-
114
-
115
-
116
-
117
-
118
-
119
-
120
-
121
-
122
-
123
-
124
-
125
-
126
-
127
-
128
-
129
-
130
-
131
-
132
-
133
-
134
-
135
-
136
-
137
-
138
-
139
-
140
-
141
-
142
-
143
-
144
-
145
-
146
 |
 |

Unit shipments increased 49% to 217.4 million units in 2006, compared to 146.0 million units in 2005. The
overall increase was driven by increased unit shipments of products for GSM, CDMA and 3G technologies,
partially offset by decreased unit shipments of products for iDEN technology. For the full year 2006, unit
shipments by the segment increased in all regions. Due to the segment’s increase in unit shipments outpacing
overall growth in the worldwide handset market, which grew approximately 20% in 2006, the segment believes
that it expanded its global handset market share to an estimated 22% for the full year 2006.
In 2006, ASP decreased approximately 11% compared to 2005. The overall decrease in ASP was driven
primarily by changes in the geographic and product-tier mix of sales. By comparison, ASP decreased approximately
10% in 2005 and increased approximately 15% in 2004. ASP is impacted by numerous factors, including product
mix, market conditions and competitive product offerings, and ASP trends often vary over time.
In 2006, the largest of the segment’s end customers (including sales through distributors) were China Mobile,
Verizon, Sprint Nextel, Cingular, and T-Mobile. These five largest customers accounted for approximately 39% of
the segment’s net sales in 2006. Besides selling directly to carriers and operators, the segment also sold products
through a variety of third-party distributors and retailers, which accounted for approximately 38% of the
segment’s net sales. The largest of these distributors was Brightstar Corporation.
Although the U.S. market continued to be the segment’s largest individual market, many of our customers, and
more than 65% of the segment’s 2006 net sales, were outside the U.S. The largest of these international markets
were China, Brazil, the United Kingdom and Mexico.
Home and Networks Mobility Segment
The Home and Networks Mobility segment designs, manufactures, sells, installs and services: (i) digital video,
Internet Protocol (“IP”) video and broadcast network interactive set-tops (“digital entertainment devices”), end-to-
end video delivery solutions, broadband access infrastructure systems, and associated data and voice customer
premise equipment (“broadband gateways”) to cable television and telecom service providers (collectively, referred
to as the “home business”), and (ii) wireless access systems (“wireless networks”), including cellular infrastructure
systems and wireless broadband systems, to wireless service providers. In 2007, the segment’s net sales represented
27% of the Company’s consolidated net sales, compared to 21% in 2006 and 26% in 2005.
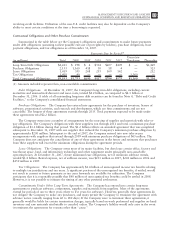
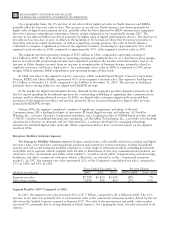
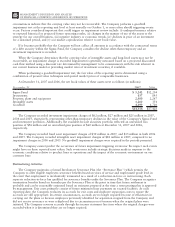
(Dollars in millions) 2007 2006 2005 2007—2006 2006—2005
Years Ended December 31 Percent Change
Segment net sales $10,014 $9,164 $9,037 9%1%
Operating earnings 709 787 1,232 (10)% (36)%
Segment Results—2007 Compared to 2006
In 2007, the segment’s net sales increased 9% to $10.0 billion, compared to $9.2 billion in 2006. The 9%
increase in net sales reflects a 27% increase in net sales in the home business, partially offset by a 1% decrease in
net sales of wireless networks. Net sales of digital entertainment devices increased approximately 43%, reflecting
increased demand for digital set-tops, including HD/DVR set-tops and IP set-tops, partially offset by a decline in
ASP due to a product mix shift towards all-digital set-tops. Unit shipments of digital entertainment devices
increased 51% to 15.2 million units. Net sales of broadband gateways increased approximately 6%, primarily due
to higher net sales of data modems, driven by net sales from the Netopia business acquired in February 2007. Net
sales of wireless networks decreased 1%, primarily driven by lower net sales of iDEN and CDMA infrastructure
equipment, partially offset by higher net sales of GSM infrastructure equipment, despite competitive pricing
pressure.
On a geographic basis, the 9% increase in net sales reflects higher net sales in all geographic regions. The
increase in net sales in North America was driven primarily by higher sales of digital entertainment devices,
partially offset by lower net sales of iDEN and CDMA infrastructure equipment. The increase in net sales in Asia
was primarily due to higher net sales of GSM infrastructure equipment, partially offset by lower net sales of
CDMA infrastructure equipment. The increase in net sales in EMEA was, primarily due to higher net sales of GSM
infrastructure equipment, partially offset by lower demand for iDEN and CDMA infrastructure equipment. Net
sales in North America continue to comprise a significant portion of the segment’s business, accounting for 52% of
the segment’s total net sales in 2007, compared to 56% of the segment’s total net sales in 2006.
60 MANAGEMENT’S DISCUSSION AND ANALYSIS
OF FINANCIAL CONDITION AND RESULTS OF OPERATIONS