Motorola 2007 Annual Report Download - page 58
Download and view the complete annual report
Please find page 58 of the 2007 Motorola annual report below. You can navigate through the pages in the report by either clicking on the pages listed below, or by using the keyword search tool below to find specific information within the annual report.-
 1
1 -
2
-
3
-
4
-
5
-
6
-
7
-
8
-
9
-
10
-
11
-
12
-
13
-
14
-
15
-
16
-
17
-
18
-
19
-
20
-
21
-
22
-
23
-
24
-
25
-
26
-
27
-
28
-
29
-
30
-
31
-
32
-
33
-
34
-
35
-
36
-
37
-
38
-
39
-
40
-
41
-
42
-
43
-
44
-
45
-
46
-
47
-
 48
48 -
 49
49 -
 50
50 -
 51
51 -
 52
52 -
 53
53 -
 54
54 -
 55
55 -
 56
56 -
 57
57 -
 58
58 -
 59
59 -
 60
60 -
 61
61 -
 62
62 -
 63
63 -
 64
64 -
 65
65 -
 66
66 -
 67
67 -
 68
68 -
69
-
70
-
71
-
72
-
73
-
74
-
75
-
76
-
77
-
78
-
79
-
80
-
81
-
82
-
83
-
84
-
85
-
86
-
87
-
88
-
89
-
90
-
91
-
92
-
93
-
94
-
95
-
96
-
97
-
98
-
99
-
100
-
101
-
102
-
103
-
104
-
105
-
106
-
107
-
108
-
109
-
110
-
111
-
112
-
113
-
114
-
115
-
116
-
117
-
118
-
119
-
120
-
121
-
122
-
123
-
124
-
125
-
126
-
127
-
128
-
129
-
130
-
131
-
132
-
133
-
134
-
135
-
136
-
137
-
138
-
139
-
140
-
141
-
142
-
143
-
144
-
145
-
146
 |
 |

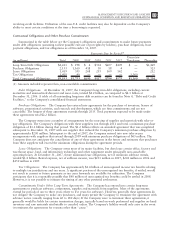
During 2005, approximately 1,400 employees, of which 300 were direct employees and 1,100 were indirect
employees, were separated from the Company. The $60 million used in 2005 reflected cash payments to these
separated employees. The remaining accrual of $53 million was included in Accrued liabilities in the Company’s
consolidated balance sheets at December 31, 2005.
Liquidity and Capital Resources
As highlighted in the consolidated statements of cash flows, the Company’s liquidity and available capital
resources are impacted by four key components: (i) current cash and cash equivalents, (ii) operating activities,
(iii) investing activities, and (iv) financing activities.
Cash and Cash Equivalents
During 2007, the Company’s cash and cash equivalents (which are highly-liquid investments with an original
maturity of three months or less) decreased by $64 million to $2.8 billion at December 31, 2007, compared to
$2.8 billion at December 31, 2006. At December 31, 2007, $230 million of this amount was held in the U.S. and
$2.5 billion was held by the Company or its subsidiaries in other countries. Repatriation of some of these funds
could be subject to delay and could have potential adverse tax consequences. At December 31, 2007, restricted
cash was $158 million, compared to $131 million of December 31, 2006.
The Company has approximately $2.7 billion of earnings in foreign subsidiaries that are not permanently
reinvested and may be repatriated without additional U.S. federal income tax charges to the Company’s
consolidated statements of operations, given the U.S. federal tax provisions accrued on undistributed earnings and
the utilization of available foreign tax credits. On a cash basis, these repatriations from the Company’s
non-U.S. subsidiaries could require the payment of additional foreign taxes, which would be creditable against
U.S. federal income taxes. The repatriation of some of these funds could also be subject to delay for local country
approvals.
Operating Activities
The Company has generated positive cash flow from continuing operations in each of the last seven years. The
cash provided by operating activities from continuing operations in 2007 was $785 million, compared to
$3.5 billion in 2006, and $4.3 billion in 2005. The primary contributors to cash flow from operations in 2007
were: (i) a $2.5 billion decrease in accounts receivable, (ii) a $556 million decrease in inventories, (iii) earnings
from continuing operations (adjusted for non-cash items) of $529 million, and (iv) a $170 million cash inflow due
to changes in other assets and liabilities. These positive contributors to operating cash flow were partially offset
by: (i) a $2.3 billion decrease in accounts payable and accrued liabilities, and (ii) a $705 million increase in other
current assets.
Accounts Receivable: The Company’s net accounts receivable were $5.3 billion at December 31, 2007,
compared to $7.5 billion at December 31, 2006. The Company’s days sales outstanding (“DSO”), including net
long-term receivables, were 50 days at December 31, 2007, compared to 58 days at December 31, 2006. The
Company’s businesses sell their products in a variety of markets throughout the world and payment terms can vary
by market type and geographic location. Accordingly, the Company’s levels of net accounts receivable and DSO
can be impacted by the timing and level of sales that are made by its various businesses and by the geographic
locations in which those sales are made. In addition, from time to time, the Company elects to sell accounts
receivable to third parties. The Company’s levels of net accounts receivable and DSO can be impacted by the
timing and amount of such sales, which can vary by period and can be impacted by numerous factors.
Inventory: The Company’s net inventory was $2.8 billion at December 31, 2007, compared to $3.2 billion at
December 31, 2006. The Company’s inventory turns decreased to 10.0 at December 31, 2007, compared to 11.0
at December 31, 2006, primarily due to lower than expected sales volumes in the Mobile Devices business.
Inventory turns were calculated using an annualized rolling three months of cost of sales method. The Company’s
days sales in inventory (“DSI”) was 36 days at December 31, 2007, compared to 32 days at December 31, 2006.
DSI is calculated by dividing net inventory by the average daily cost of sales. Inventory management continues to
be an area of focus as the Company balances the need to maintain strategic inventory levels to ensure competitive
delivery performance to its customers against the risk of inventory obsolescence due to rapidly changing
technology and customer spending requirements.
50 MANAGEMENT’S DISCUSSION AND ANALYSIS
OF FINANCIAL CONDITION AND RESULTS OF OPERATIONS