Motorola 2007 Annual Report Download - page 119
Download and view the complete annual report
Please find page 119 of the 2007 Motorola annual report below. You can navigate through the pages in the report by either clicking on the pages listed below, or by using the keyword search tool below to find specific information within the annual report.-
 1
1 -
2
-
3
-
4
-
5
-
6
-
7
-
8
-
9
-
10
-
11
-
12
-
13
-
14
-
15
-
16
-
17
-
18
-
19
-
20
-
21
-
22
-
23
-
24
-
25
-
26
-
27
-
28
-
29
-
30
-
31
-
32
-
33
-
34
-
35
-
36
-
37
-
38
-
39
-
40
-
41
-
42
-
43
-
44
-
45
-
46
-
47
-
48
-
49
-
50
-
51
-
52
-
53
-
54
-
55
-
56
-
57
-
58
-
59
-
60
-
61
-
62
-
63
-
64
-
65
-
66
-
67
-
68
-
69
-
70
-
71
-
72
-
73
-
74
-
75
-
76
-
77
-
78
-
79
-
80
-
81
-
82
-
83
-
84
-
85
-
86
-
87
-
88
-
89
-
90
-
91
-
92
-
93
-
94
-
95
-
96
-
97
-
98
-
99
-
100
-
101
-
102
-
103
-
104
-
105
-
106
-
107
-
108
-
 109
109 -
 110
110 -
 111
111 -
 112
112 -
 113
113 -
 114
114 -
 115
115 -
 116
116 -
 117
117 -
 118
118 -
 119
119 -
 120
120 -
 121
121 -
 122
122 -
 123
123 -
 124
124 -
 125
125 -
 126
126 -
 127
127 -
 128
128 -
 129
129 -
130
-
131
-
132
-
133
-
134
-
135
-
136
-
137
-
138
-
139
-
140
-
141
-
142
-
143
-
144
-
145
-
146
 |
 |

• The Home and Networks Mobility segment designs, manufactures, sells, installs and services: (i) digital video,
Internet Protocol (“IP”) video and broadcast network interactive set-tops (“digital entertainment devices”), end-
to-end video delivery solutions, broadband access infrastructure systems, and associated data and voice
customer premise equipment (“broadband gateways”) to cable television and telecom service providers
(collectively, referred to as the “home business”), and (ii) wireless access systems (“wireless networks”),
including cellular infrastructure systems and wireless broadband systems, to wireless service providers.
• The Enterprise Mobility Solutions segment designs, manufactures, sells, installs and services analog and
digital two-way radio, voice and data communications products and systems for private networks, wireless
broadband systems and end-to-end enterprise mobility solutions to a wide range of enterprise markets,
including government and public safety agencies (which, together with all sales to distributors of two-way
communication products, are referred to as the “government and public safety market”), as well as retail,
utility, transportation, manufacturing, healthcare and other commercial customers (which, collectively, are
referred to as the “commercial enterprise market”).
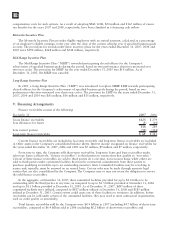
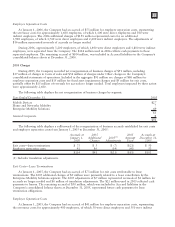
Segment operating results are measured based on operating earnings adjusted, if necessary, for certain
segment-specific items and corporate allocations. Intersegment and intergeographic sales are accounted for on an
arm’s-length pricing basis. Intersegment sales included in other and eliminations were:
Years Ended December 31 2007 2006 2005
Mobile Devices $56 $ 65 $190
Home and Networks Mobility 14 13 7
Enterprise Mobility Solutions 58 31 45
$128 $109 $242
Identifiable assets (excluding intersegment receivables) are the Company’s assets that are identified with classes
of similar products or operations in each geographic region.
For the year ended December 31, 2005, approximately 12% of net sales were to one customer, Sprint Nextel
(including Nextel and Nextel affiliates where appropriate). No single customer accounted for more than 10% of
net sales for the years ended December 31, 2007 and 2006.
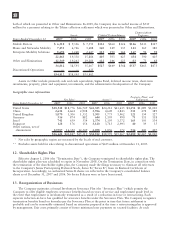
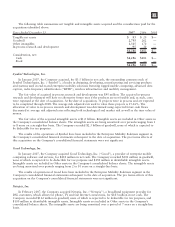
Segment information
Years Ended December 31 2007 2006 2005 2007 2006 2005
Net Sales Operating Earnings (Loss)
Mobile Devices $18,988 $28,383 $21,459 $(1,201) $2,690 $2,192
Home and Networks Mobility 10,014 9,164 9,037 709 787 1,232
Enterprise Mobility Solutions 7,729 5,400 5,038 1,213 958 860
36,761 42,947 35,534 721 4,435 4,284
Other and Eliminations (109) (100) (224) (1,274) (343) 321
$36,622 $42,847 $35,310
Operating earnings (loss) (553) 4,092 4,605
Total other income 163 518 1,807
Earnings (loss) from continuing operations before
income taxes $ (390) $4,610 $6,412
Other and Eliminations is primarily comprised of: (i) amortization of intangible assets and acquisition-related
in-process research and development charges relating to all of the Company’s acquisitions, (ii) general corporate-
related expenses, including stock option and employee stock purchase plan expenses, (iii) various corporate
programs representing developmental businesses and research and development projects, which are not included in
any other segment, and (iv) the Company’s wholly-owned finance subsidiary.
Additionally, included in Other and Eliminations in 2007 are: (i) net charges of $140 million relating to the
Telsim class action securities legal settlement, partially offset by estimated insurance recoveries, and (ii) charges of
$81 million relating to an impairment of intangible assets. In 2006, the Company also recorded expenses of
$88 million representing a charitable contribution to the Motorola Foundation of appreciated equity holdings in a
third party, partially offset by income of $418 million for a payment relating to the Telsim collection settlement
111