Motorola 2007 Annual Report Download - page 84
Download and view the complete annual report
Please find page 84 of the 2007 Motorola annual report below. You can navigate through the pages in the report by either clicking on the pages listed below, or by using the keyword search tool below to find specific information within the annual report.-
 1
1 -
2
-
3
-
4
-
5
-
6
-
7
-
8
-
9
-
10
-
11
-
12
-
13
-
14
-
15
-
16
-
17
-
18
-
19
-
20
-
21
-
22
-
23
-
24
-
25
-
26
-
27
-
28
-
29
-
30
-
31
-
32
-
33
-
34
-
35
-
36
-
37
-
38
-
39
-
40
-
41
-
42
-
43
-
44
-
45
-
46
-
47
-
48
-
49
-
50
-
51
-
52
-
53
-
54
-
55
-
56
-
57
-
58
-
59
-
60
-
61
-
62
-
63
-
64
-
65
-
66
-
67
-
68
-
69
-
70
-
71
-
72
-
73
-
 74
74 -
 75
75 -
 76
76 -
 77
77 -
 78
78 -
 79
79 -
 80
80 -
 81
81 -
 82
82 -
 83
83 -
 84
84 -
 85
85 -
 86
86 -
 87
87 -
 88
88 -
 89
89 -
 90
90 -
 91
91 -
 92
92 -
 93
93 -
 94
94 -
95
-
96
-
97
-
98
-
99
-
100
-
101
-
102
-
103
-
104
-
105
-
106
-
107
-
108
-
109
-
110
-
111
-
112
-
113
-
114
-
115
-
116
-
117
-
118
-
119
-
120
-
121
-
122
-
123
-
124
-
125
-
126
-
127
-
128
-
129
-
130
-
131
-
132
-
133
-
134
-
135
-
136
-
137
-
138
-
139
-
140
-
141
-
142
-
143
-
144
-
145
-
146
 |
 |

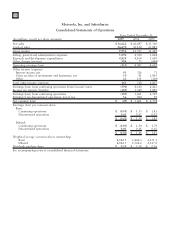
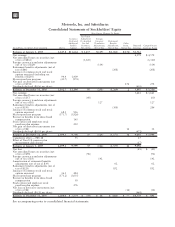
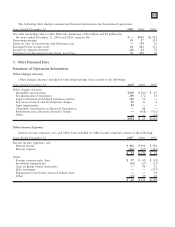
Motorola, Inc. and Subsidiaries
Consolidated Statements of Operations
(In millions, except per share amounts) 2007 2006 2005
Years Ended December 31
Net sales $ 36,622 $ 42,847 $ 35,310
Costs of sales 26,670 30,120 23,881
Gross margin 9,952 12,727 11,429
Selling, general and administrative expenses 5,092 4,504 3,628
Research and development expenditures 4,429 4,106 3,600
Other charges (income) 984 25 (404)
Operating earnings (loss) (553) 4,092 4,605
Other income (expense):
Interest income, net 91 326 71
Gains on sales of investments and businesses, net 50 41 1,845
Other 22 151 (109)
Total other income (expense) 163 518 1,807
Earnings (loss) from continuing operations before income taxes (390) 4,610 6,412
Income tax expense (benefit) (285) 1,349 1,893
Earnings (loss) from continuing operations (105) 3,261 4,519
Earnings from discontinued operations, net of tax 56 400 59
Net earnings (loss) $ (49) $ 3,661 $ 4,578
Earnings (loss) per common share:
Basic:
Continuing operations $ (0.05) $ 1.33 $ 1.83
Discontinued operations 0.03 0.17 0.02
$ (0.02) $ 1.50 $ 1.85
Diluted:
Continuing operations $ (0.05) $ 1.30 $ 1.79
Discontinued operations 0.03 0.16 0.02
$ (0.02) $ 1.46 $ 1.81
Weighted average common shares outstanding:
Basic 2,312.7 2,446.3 2,471.3
Diluted 2,312.7 2,504.2 2,527.0
Dividends paid per share $ 0.20 $ 0.18 $ 0.16
See accompanying notes to consolidated financial statements.
76