Motorola 2007 Annual Report Download - page 44
Download and view the complete annual report
Please find page 44 of the 2007 Motorola annual report below. You can navigate through the pages in the report by either clicking on the pages listed below, or by using the keyword search tool below to find specific information within the annual report.
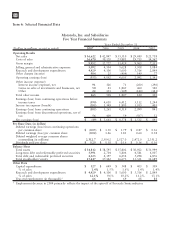
Item 6: Selected Financial Data
Motorola, Inc. and Subsidiaries
Five Year Financial Summary
(Dollars in millions, except as noted) 2007 2006 2005 2004 2003
Years Ended December 31
Operating Results
Net sales $ 36,622 $ 42,847 $ 35,310 $ 29,680 $ 21,718
Costs of sales 26,670 30,120 23,881 19,715 14,567
Gross margin 9,952 12,727 11,429 9,965 7,151
Selling, general and administrative expenses 5,092 4,504 3,628 3,508 3,084
Research and development expenditures 4,429 4,106 3,600 3,316 2,849
Other charges (income) 984 25 (404) 149 77
Operating earnings (loss) (553) 4,092 4,605 2,992 1,141
Other income (expense):
Interest income (expense), net 91 326 71 (200) (296)
Gains on sales of investments and businesses, net 50 41 1,845 460 540
Other 22 151 (109) (140) (141)
Total other income 163 518 1,807 120 103
Earnings (loss) from continuing operations before
income taxes (390) 4,610 6,412 3,112 1,244
Income tax expense (benefit) (285) 1,349 1,893 1,013 403
Earnings (loss) from continuing operations (105) 3,261 4,519 2,099 841
Earnings (loss) from discontinued operations, net of
tax 56 400 59 (567) 52
Net earnings (loss) $ (49) $ 3,661 $ 4,578 $ 1,532 $ 893
Per Share Data (in dollars)
Diluted earnings (loss) from continuing operations
per common share $ (0.05) $ 1.30 $ 1.79 $ 0.87 $ 0.36
Diluted earnings (loss) per common share (0.02) 1.46 1.81 0.64 0.38
Diluted weighted average common shares
outstanding (in millions) 2,312.7 2,504.2 2,527.0 2,472.0 2,351.2
Dividends paid per share $ 0.20 $ 0.18 $ 0.16 $ 0.16 $ 0.16
Balance Sheet
Total assets $ 34,812 $ 38,593 $ 35,802 $ 30,922 $ 31,999
Long-term debt and redeemable preferred securities 3,991 2,704 3,806 4,581 6,007
Total debt and redeemable preferred securities 4,323 4,397 4,254 5,298 6,876
Total stockholders’ equity 15,447 17,142 16,673 13,331 12,689
Other Data
Capital expenditures $ 527 $ 649 $ 548 $ 405 $ 309
% of sales 1.4% 1.5% 1.6% 1.4% 1.4%
Research and development expenditures $ 4,429 $ 4,106 $ 3,600 $ 3,316 $ 2,849
% of sales 12.1% 9.6% 10.2% 11.2% 13.1%
Year-end employment (in thousands)* 66 66 69 68 88
* Employment decrease in 2004 primarily reflects the impact of the spin-off of Freescale Semiconductor.
36


