Motorola 2007 Annual Report Download - page 115
Download and view the complete annual report
Please find page 115 of the 2007 Motorola annual report below. You can navigate through the pages in the report by either clicking on the pages listed below, or by using the keyword search tool below to find specific information within the annual report.-
 1
1 -
2
-
3
-
4
-
5
-
6
-
7
-
8
-
9
-
10
-
11
-
12
-
13
-
14
-
15
-
16
-
17
-
18
-
19
-
20
-
21
-
22
-
23
-
24
-
25
-
26
-
27
-
28
-
29
-
30
-
31
-
32
-
33
-
34
-
35
-
36
-
37
-
38
-
39
-
40
-
41
-
42
-
43
-
44
-
45
-
46
-
47
-
48
-
49
-
50
-
51
-
52
-
53
-
54
-
55
-
56
-
57
-
58
-
59
-
60
-
61
-
62
-
63
-
64
-
65
-
66
-
67
-
68
-
69
-
70
-
71
-
72
-
73
-
74
-
75
-
76
-
77
-
78
-
79
-
80
-
81
-
82
-
83
-
84
-
85
-
86
-
87
-
88
-
89
-
90
-
91
-
92
-
93
-
94
-
95
-
96
-
97
-
98
-
99
-
100
-
101
-
102
-
103
-
104
-
 105
105 -
 106
106 -
 107
107 -
 108
108 -
 109
109 -
 110
110 -
 111
111 -
 112
112 -
 113
113 -
 114
114 -
 115
115 -
 116
116 -
 117
117 -
 118
118 -
 119
119 -
 120
120 -
 121
121 -
 122
122 -
 123
123 -
 124
124 -
 125
125 -
126
-
127
-
128
-
129
-
130
-
131
-
132
-
133
-
134
-
135
-
136
-
137
-
138
-
139
-
140
-
141
-
142
-
143
-
144
-
145
-
146
 |
 |
Restricted stock and restricted stock unit activity was as follows (in thousands, except fair value):
Years Ended December 31 RS and RSU
Wtd. Avg.
Grant Date
Fair Value RS and RSU
Wtd Avg.
Grant Date
Fair Value
2007 2006
RS and RSU outstanding at January 1 6,016 $19 4,383 $16
Granted 7,766 18 2,761 22
Vested (1,068) 19 (938) 15
Terminated, canceled or expired (1,959) 19 (190) 18
RS and RSU outstanding at December 31 10,755 17 6,016 19
At December 31, 2007, the Company had unrecognized compensation expense related to restricted stock and
restricted stock units of $113 million, expected to be recognized over the weighted average period of
approximately three years. An aggregate of approximately 7.8 million, 2.8 million and 1.7 million shares of
restricted stock and restricted stock units were granted in 2007, 2006 and 2005, respectively. The amortization of
unrecognized compensation for the years ended December 31, 2007, 2006 and 2005 was $39 million, $24 million
and $14 million, respectively. The total fair value of restricted stock and restricted stock unit shares vested during
the years ended December 31, 2007, 2006 and 2005 was $13 million, $22 million and $32 million, respectively.
The aggregate intrinsic value of outstanding restricted stock and restricted stock units as of December 31, 2007
was $173 million.
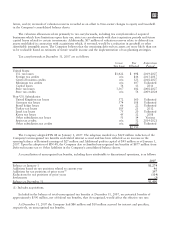
Total Share-Based Compensation Presentation
Under the modified prospective transition method, results for 2005 have not been restated to reflect the effects
of implementing SFAS 123R. The following pro forma information is presented for comparative purposes and
illustrate the pro forma effect on Earnings from continuing operations and Net earnings and the respective earnings
per share for each period presented as if the Company had applied the fair value recognition provisions to share-
based employee compensation prior to 2006 (in millions, except per share amounts):
Years Ended December 31 2007 2006 2005 2007 2006 2005
Continuing Operations Net Earnings (Loss)
Earnings (loss):
Earnings (loss), as reported $ (105) $3,261 $4,519 $ (49) $3,661 $4,578
Add: Share-based employee compensation expense
included in reported earnings, net of related tax
effects n/a n/a 9 n/a n/a 9
Deduct: Share-based employee compensation
expense determined under fair value-based
method for all awards, net of related tax effects n/a n/a (170) n/a n/a (170)
Pro forma earnings (loss) $ (105) $3,261 $4,358 $ (49) $3,661 $4,417
Basic earnings (loss) per common share:
As reported $(0.05) $ 1.33 $ 1.83 $(0.02) $ 1.50 $ 1.85
Pro forma $ n/a $ n/a $ 1.76 $ n/a $ n/a $ 1.79
Diluted earnings (loss) per common share:
As reported $(0.05) $ 1.30 $ 1.79 $(0.02) $ 1.46 $ 1.81
Pro forma $ n/a $ n/a $ 1.72 $ n/a $ n/a $ 1.75
Prior to adopting SFAS 123R, the Company presented all tax benefits resulting from the exercise of stock
options as operating cash flows in the consolidated statements of cash flows. As a result, $210 million of excess
tax benefits for 2005 has been classified as an operating cash inflow. SFAS 123R requires cash flows resulting from
excess tax benefits to be classified as a part of cash flows from financing activities. Excess tax benefits are realized
tax benefits from tax deductions for exercised options in excess of the deferred tax asset attributable to stock
107