Motorola 2007 Annual Report Download - page 67
Download and view the complete annual report
Please find page 67 of the 2007 Motorola annual report below. You can navigate through the pages in the report by either clicking on the pages listed below, or by using the keyword search tool below to find specific information within the annual report.-
 1
1 -
2
-
3
-
4
-
5
-
6
-
7
-
8
-
9
-
10
-
11
-
12
-
13
-
14
-
15
-
16
-
17
-
18
-
19
-
20
-
21
-
22
-
23
-
24
-
25
-
26
-
27
-
28
-
29
-
30
-
31
-
32
-
33
-
34
-
35
-
36
-
37
-
38
-
39
-
40
-
41
-
42
-
43
-
44
-
45
-
46
-
47
-
48
-
49
-
50
-
51
-
52
-
53
-
54
-
55
-
56
-
 57
57 -
 58
58 -
 59
59 -
 60
60 -
 61
61 -
 62
62 -
 63
63 -
 64
64 -
 65
65 -
 66
66 -
 67
67 -
 68
68 -
 69
69 -
 70
70 -
 71
71 -
 72
72 -
 73
73 -
 74
74 -
 75
75 -
 76
76 -
 77
77 -
78
-
79
-
80
-
81
-
82
-
83
-
84
-
85
-
86
-
87
-
88
-
89
-
90
-
91
-
92
-
93
-
94
-
95
-
96
-
97
-
98
-
99
-
100
-
101
-
102
-
103
-
104
-
105
-
106
-
107
-
108
-
109
-
110
-
111
-
112
-
113
-
114
-
115
-
116
-
117
-
118
-
119
-
120
-
121
-
122
-
123
-
124
-
125
-
126
-
127
-
128
-
129
-
130
-
131
-
132
-
133
-
134
-
135
-
136
-
137
-
138
-
139
-
140
-
141
-
142
-
143
-
144
-
145
-
146
 |
 |

facility. Selling, general and administrative (“SG&A”) expenses decreased primarily due to lower marketing
expenses and savings from cost-reduction initiatives, partially offset by increased expenditures on information
technology upgrades. As a percentage of net sales in 2007 as compared to 2006, gross margin and operating
margin decreased, and SG&A expenses and R&D expenditures increased.
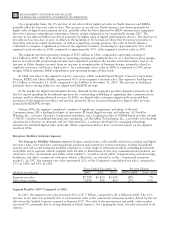
The segment’s backlog was $647 million at December 31, 2007, compared to $1.4 billion at December 31,
2006. This decrease in backlog is primarily due to a decline in customer demand driven by the gaps in the
segment’s product portfolio.
The segment shipped 159.1 million units in 2007, a 27% decrease compared to shipments of 217.4 million
units in 2006. The overall decrease reflects decreased unit shipments of products for all technologies. For the full
year 2007, unit shipments: (i) decreased substantially in Asia and EMEA, (ii) decreased in North America, and
(iii) increased in Latin America. Although unit shipments by the segment decreased in 2007, total unit shipments in
the worldwide handset market increased by 16%. The segment estimates its worldwide market share to be
approximately 14% for the full year 2007, a decrease of approximately 8 percentage points versus full year 2006.
In 2007, ASP decreased approximately 9% compared to 2006. The overall decrease in ASP was driven
primarily by changes in the product-tier and geographic mix of sales. By comparison, ASP decreased approximately
11% in 2006 and 10% in 2005. ASP is impacted by numerous factors, including product mix, market conditions
and competitive product offerings, and ASP trends often vary over time.
The largest of the segment’s end customers (including sales through distributors) are Sprint Nextel, AT&T,
Verizon, China Mobile, and America Movil. In 2007, aggregate net sales to these five customers accounted for
approximately 42% of the segment’s net sales in 2007. Besides selling directly to carriers and operators, the
segment also sells products through a variety of third-party distributors and retailers, which account for
approximately 33% of the segment’s net sales. The largest of these distributors is Brightstar Corporation. The loss
of any of the segment’s key customers could have a significant impact on the segment’s business.
Although the U.S. market continued to be the segment’s largest individual market, many of our customers, and
more than 54% of our segment’s 2007 net sales, were outside the U.S. The largest of these international markets
are Brazil, China and Mexico.
In January 2008, the Company announced that it is evaluating alternatives for the structural and strategic
realignment of the Mobile Devices business to better equip it to recapture global market leadership and enhance
shareholder value. This may include the separation of the Mobile Devices business from Motorola’s other
businesses to permit each to grow and better serve their customers.
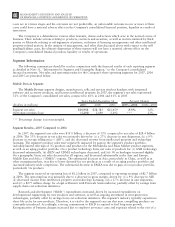
Segment Results—2006 Compared to 2005
In 2006, the segment’s net sales increased 32% to $28.4 billion, compared to $21.5 billion in 2005. The
increase in net sales was driven by a 49% increase in unit shipments, primarily driven by strong demand for GSM
and CDMA handsets, partially offset by an 11% decrease in average selling price (“ASP”). On a product
technology basis, net sales of products for GSM and CDMA technologies increased and net sales of products for
iDEN and 3G technologies decreased. On a geographic basis, net sales increased in all regions.
The segment’s operating earnings increased to $2.7 billion in 2006, compared to operating earnings of
$2.2 billion in 2005. The 23% increase in operating earnings was primarily due to an increase in gross margin,
driven primarily by: (i) the 49% increase in unit shipments, (ii) savings from supply chain cost-reduction initiatives,
and (iii) increased income from intellectual property and technology licensing, partially offset by the 11% decline
in ASP. The increase in gross margin was partially offset by: (i) an increase in SG&A expenses, primarily driven by
an increase in marketing expenses to support higher net sales and promote brand awareness, and (ii) an increase in
R&D expenditures, as a result of an increase in developmental engineering for new product development and
software, as well as ongoing investment in next-generation technologies. As a percentage of net sales in 2006 as
compared to 2005, gross margin, R&D expenditures and operating margin decreased and SG&A expenses
increased.
The segment’s backlog was $1.4 billion at December 31, 2006, compared to $3.0 billion at December 31,
2005. This decrease in backlog is primarily due to an unusually high level of backlog at December 31, 2005 due to
strong customer demand for new products during the fourth quarter of 2005, certain of which were unable to be
shipped in significant quantities due to supply constraints for select components.
59
MANAGEMENT’S DISCUSSION AND ANALYSIS
OF FINANCIAL CONDITION AND RESULTS OF OPERATIONS