Motorola 2007 Annual Report Download - page 70
Download and view the complete annual report
Please find page 70 of the 2007 Motorola annual report below. You can navigate through the pages in the report by either clicking on the pages listed below, or by using the keyword search tool below to find specific information within the annual report.-
 1
1 -
2
-
3
-
4
-
5
-
6
-
7
-
8
-
9
-
10
-
11
-
12
-
13
-
14
-
15
-
16
-
17
-
18
-
19
-
20
-
21
-
22
-
23
-
24
-
25
-
26
-
27
-
28
-
29
-
30
-
31
-
32
-
33
-
34
-
35
-
36
-
37
-
38
-
39
-
40
-
41
-
42
-
43
-
44
-
45
-
46
-
47
-
48
-
49
-
50
-
51
-
52
-
53
-
54
-
55
-
56
-
57
-
58
-
59
-
 60
60 -
 61
61 -
 62
62 -
 63
63 -
 64
64 -
 65
65 -
 66
66 -
 67
67 -
 68
68 -
 69
69 -
 70
70 -
 71
71 -
 72
72 -
 73
73 -
 74
74 -
 75
75 -
 76
76 -
 77
77 -
 78
78 -
 79
79 -
 80
80 -
81
-
82
-
83
-
84
-
85
-
86
-
87
-
88
-
89
-
90
-
91
-
92
-
93
-
94
-
95
-
96
-
97
-
98
-
99
-
100
-
101
-
102
-
103
-
104
-
105
-
106
-
107
-
108
-
109
-
110
-
111
-
112
-
113
-
114
-
115
-
116
-
117
-
118
-
119
-
120
-
121
-
122
-
123
-
124
-
125
-
126
-
127
-
128
-
129
-
130
-
131
-
132
-
133
-
134
-
135
-
136
-
137
-
138
-
139
-
140
-
141
-
142
-
143
-
144
-
145
-
146
 |
 |

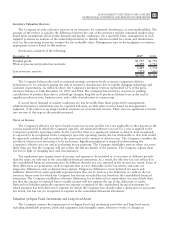
On a geographic basis, the 1% increase in net sales reflects higher net sales in North America and EMEA,
partially offset by lower net sales in Asia. The increase in net sales in North America was driven primarily by
higher sales of digital entertainment devices, partially offset by lower demand for iDEN infrastructure equipment
driven by customer expenditures returning to historic trends compared to an exceptionally strong 2005. The
increase in net sales in EMEA was driven primarily by higher sales of digital entertainment devices. The decrease in
net sales in Asia was due, in part, to delays in the granting of 3G licenses in China that led service providers to
slow their near-term capital investment, as well as competitive pricing pressure. Net sales in North America
continued to comprise a significant portion of the segment’s business, accounting for approximately 56% of the
segment’s total net sales in 2006, compared to approximately 55% of the segment’s total net sales in 2005.
The segment reported operating earnings of $787 million in 2006, compared to operating earnings of
$1.2 billion in 2005. The 36% decrease in operating earnings was primarily due to: (i) a decrease in gross margin,
due to an unfavorable product/regional mix and competitive pricing in the wireless networks market, and (ii) an
increase in Other charges (income) from an increase in reorganization of business charges, primarily related to
employee severance, and from a legal reserve. As a percentage of net sales in 2006 as compared to 2005, gross
margin, SG&A expenses, R&D expenditures and operating margin all decreased.
In 2006, net sales to the segment’s top five customers, which included Sprint Nextel, Comcast Corporation,
Verizon, KDDI and China Mobile, represented 45% of the segment’s total net sales. The segment’s backlog was
$3.2 billion at December 31, 2006, compared to $2.4 billion at December 31, 2005. The increase in backlog is
primarily due to strong orders for our digital and HD/DVR set-tops.
In the market for digital entertainment devices, demand for the segment’s products depends primarily on the
level of capital spending by broadband operators for constructing, rebuilding or upgrading their communications
systems, and for offering advanced services. In 2006, our digital video customers significantly increased their
purchases of the segment’s products and services, primarily due to increased demand for digital video set-tops,
particularly HD/DVR set-tops.
During 2006, the segment completed a number of significant acquisitions, including: (i) Kreatel
Communications AB, a leading developer of innovative IP-based digital set-tops and software, (ii) NextNet
Wireless, Inc., a former Clearwire Corporation subsidiary and a leading provider of OFDM-based non-line-of-sight
(“NLOS”) wireless broadband infrastructure equipment, (iii) Broadbus Technologies, Inc., a provider of technology
solutions for television on demand, and (iv) Vertasent LLC, a software developer for managing technology
elements for switched digital video networks. These acquisitions did not have a material impact on the segment
results in 2006.
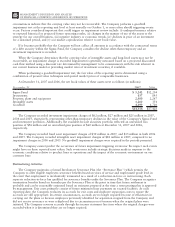
Enterprise Mobility Solutions Segment
The Enterprise Mobility Solutions segment designs, manufactures, sells, installs and services analog and digital
two-way radio, voice and data communications products and systems for private networks, wireless broadband
systems and end-to-end enterprise mobility solutions to a wide range of enterprise markets, including government
and public safety agencies (which, together with all sales to distributors of two-way communications products, are
referred to as the “government and public safety market”), as well as retail, utility, transportation, manufacturing,
healthcare and other commercial customers (which, collectively, are referred to as the “commercial enterprise
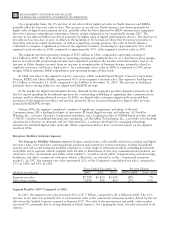
market”). In 2007, the segment’s net sales represented 21% of the Company’s consolidated net sales, compared to
13% in 2006 and 14% in 2005.
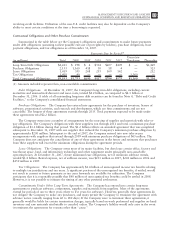
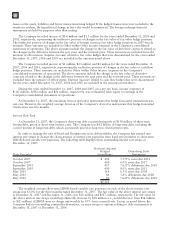
(Dollars in millions) 2007 2006 2005 2007—2006 2006—2005
Years Ended December 31 Percent Change
Segment net sales $7,729 $5,400 $5,038 43%7%
Operating earnings 1,213 958 860 27% 11%
Segment Results—2007 Compared to 2006
In 2007, the segment’s net sales increased 43% to $7.7 billion, compared to $5.4 billion in 2006. The 43%
increase in net sales was primarily due to increased net sales in the commercial enterprise market, driven by the net
sales from the Symbol business acquired in January 2007. Net sales in the government and public safety market
increased 6%, primarily due to strong demand in North America. On a geographic basis, net sales increased in all
regions.
62 MANAGEMENT’S DISCUSSION AND ANALYSIS
OF FINANCIAL CONDITION AND RESULTS OF OPERATIONS