Motorola 2007 Annual Report Download - page 50
Download and view the complete annual report
Please find page 50 of the 2007 Motorola annual report below. You can navigate through the pages in the report by either clicking on the pages listed below, or by using the keyword search tool below to find specific information within the annual report.-
 1
1 -
2
-
3
-
4
-
5
-
6
-
7
-
8
-
9
-
10
-
11
-
12
-
13
-
14
-
15
-
16
-
17
-
18
-
19
-
20
-
21
-
22
-
23
-
24
-
25
-
26
-
27
-
28
-
29
-
30
-
31
-
32
-
33
-
34
-
35
-
36
-
37
-
38
-
39
-
 40
40 -
 41
41 -
 42
42 -
 43
43 -
 44
44 -
 45
45 -
 46
46 -
 47
47 -
 48
48 -
 49
49 -
 50
50 -
 51
51 -
 52
52 -
 53
53 -
 54
54 -
 55
55 -
 56
56 -
 57
57 -
 58
58 -
 59
59 -
 60
60 -
61
-
62
-
63
-
64
-
65
-
66
-
67
-
68
-
69
-
70
-
71
-
72
-
73
-
74
-
75
-
76
-
77
-
78
-
79
-
80
-
81
-
82
-
83
-
84
-
85
-
86
-
87
-
88
-
89
-
90
-
91
-
92
-
93
-
94
-
95
-
96
-
97
-
98
-
99
-
100
-
101
-
102
-
103
-
104
-
105
-
106
-
107
-
108
-
109
-
110
-
111
-
112
-
113
-
114
-
115
-
116
-
117
-
118
-
119
-
120
-
121
-
122
-
123
-
124
-
125
-
126
-
127
-
128
-
129
-
130
-
131
-
132
-
133
-
134
-
135
-
136
-
137
-
138
-
139
-
140
-
141
-
142
-
143
-
144
-
145
-
146
 |
 |

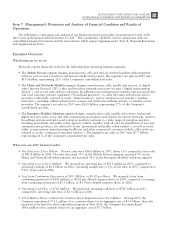
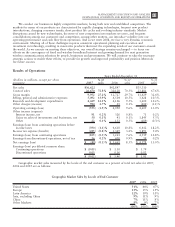
Results of Operations—2007 Compared to 2006
Net Sales
Net sales were $36.6 billion in 2007, down 15% compared to net sales of $42.8 billion in 2006. The decrease
in net sales reflects a $9.4 billion decrease in net sales b
`y the Mobile Devices segment, partially offset by a
$2.3 billion increase in net sales by the Enterprise Mobility Solutions segment and an $850 million increase in net
sales by the Home and Networks Mobility segment. The 33% decrease in net sales in the Mobile Devices segment
was primarily driven by: (i) a 27% decrease in unit shipments, (ii) a 9% decrease in average selling price (“ASP”),
and (iii) decreased revenue from intellectual property and technology licensing. The 43% increase in net sales in
the Enterprise Mobility Solutions segment was primarily driven by net sales from the Symbol business acquired in
January 2007, as well as higher net sales in the government and public safety market due to strong demand in
North America. The 9% increase in net sales in the Home and Networks Mobility segment was primarily driven
by a 51% increase in unit shipments of digital entertainment devices, partially offset by lower net sales of wireless
networks due primarily to lower demand for iDEN and CDMA infrastructure equipment.
Gross Margin
Gross margin was $10.0 billion, or 27.2% of net sales, in 2007, compared to $12.7 billion, or 29.7% of net
sales, in 2006. The decrease in gross margin reflects decreases in gross margin in the Mobile Devices and Home
and Networks Mobility segments, partially offset by an increase in gross margin in the Enterprise Mobility
Solutions segment. The decrease in gross margin in the Mobile Devices segment was primarily due to: (i) a 9%
decrease in ASP, (ii) decreased income from intellectual property and technology licensing, (iii) a 27% decrease in
unit shipments, and (iv) a $277 million charge for a legal settlement with Freescale Semiconductor, partially offset
by savings from supply chain cost-reduction initiatives. The decrease in gross margin in the Home and Networks
segment was primarily due to: (i) continuing competitive pricing pressure in the market for GSM infrastructure
equipment, and (ii) lower sales of iDEN infrastructure equipment, partially offset by increased sales of digital
entertainment devices. The increase in gross margin in the Enterprise Mobility Solutions segment was primarily due
to the 43% increase in net sales, driven by net sales from the Symbol business acquired in January 2007, as well as
higher net sales in the government and public safety market due to strong demand in North America.
Gross margin as a percentage of net sales decreased in 2007 as compared to 2006, reflecting decreases in all
three of the Company’s business segments. The Company’s overall gross margin as a percentage of net sales can be
impacted by the proportion of overall net sales generated by its various businesses.
Selling, General and Administrative Expenses
Selling, general and administrative (“SG&A”) expenses increased 13% to $5.1 billion, or 13.9% of net sales,
in 2007, compared to $4.5 billion, or 10.5% of net sales, in 2006. In 2007 compared to 2006, SG&A expenses
increased in the Enterprise Mobility Solutions and Home and Networks Mobility segments and decreased in the
Mobile Devices segment. The increases in the Enterprise Mobility Solutions and Home and Networks Mobility
segments were primarily due to expenses from recently acquired businesses, partially offset by savings from cost-
reduction initiatives. The decrease in the Mobile Devices segment was primarily due to lower marketing expenses
and savings from cost-reduction initiatives, partially offset by increased expenditures on information technology
upgrades. SG&A expenses as a percentage of net sales increased in the Mobile Devices and Enterprise Mobility
Solutions segments and decreased in the Home and Networks Mobility segment.
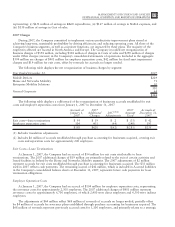
Research and Development Expenditures
Research and development (“R&D”) expenditures increased 8% to $4.4 billion, or 12.1% of net sales, in
2007, compared to $4.1 billion, or 9.5% of net sales, in 2006. In 2007 compared to 2006, R&D expenditures
increased in the Mobile Devices and Enterprise Mobility Solutions segments and decreased in the Home and
Networks Mobility segment. The increase in the Mobile Devices segment was primarily due to developmental
engineering expenditures for new product development and investment in next-generation technologies, partially
offset by savings from cost-reduction initiatives. The increase in the Enterprise Mobility Solutions segment was
primarily due to R&D expenditures incurred by recently acquired businesses, partially offset by savings from
cost-reduction initiatives. The decrease in the Home and Networks Mobility segment was primarily due to savings
from cost-reduction initiatives, partially offset by expenditures by recently acquired businesses and continued
investment in digital entertainment devices and WiMAX. R&D expenditures as a percentage of net sales increased
42 MANAGEMENT’S DISCUSSION AND ANALYSIS
OF FINANCIAL CONDITION AND RESULTS OF OPERATIONS