Motorola 2007 Annual Report Download - page 53
Download and view the complete annual report
Please find page 53 of the 2007 Motorola annual report below. You can navigate through the pages in the report by either clicking on the pages listed below, or by using the keyword search tool below to find specific information within the annual report.-
 1
1 -
2
-
3
-
4
-
5
-
6
-
7
-
8
-
9
-
10
-
11
-
12
-
13
-
14
-
15
-
16
-
17
-
18
-
19
-
20
-
21
-
22
-
23
-
24
-
25
-
26
-
27
-
28
-
29
-
30
-
31
-
32
-
33
-
34
-
35
-
36
-
37
-
38
-
39
-
40
-
41
-
42
-
 43
43 -
 44
44 -
 45
45 -
 46
46 -
 47
47 -
 48
48 -
 49
49 -
 50
50 -
 51
51 -
 52
52 -
 53
53 -
 54
54 -
 55
55 -
 56
56 -
 57
57 -
 58
58 -
 59
59 -
 60
60 -
 61
61 -
 62
62 -
 63
63 -
64
-
65
-
66
-
67
-
68
-
69
-
70
-
71
-
72
-
73
-
74
-
75
-
76
-
77
-
78
-
79
-
80
-
81
-
82
-
83
-
84
-
85
-
86
-
87
-
88
-
89
-
90
-
91
-
92
-
93
-
94
-
95
-
96
-
97
-
98
-
99
-
100
-
101
-
102
-
103
-
104
-
105
-
106
-
107
-
108
-
109
-
110
-
111
-
112
-
113
-
114
-
115
-
116
-
117
-
118
-
119
-
120
-
121
-
122
-
123
-
124
-
125
-
126
-
127
-
128
-
129
-
130
-
131
-
132
-
133
-
134
-
135
-
136
-
137
-
138
-
139
-
140
-
141
-
142
-
143
-
144
-
145
-
146
 |
 |

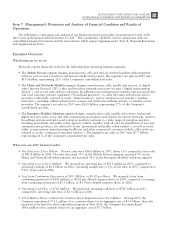
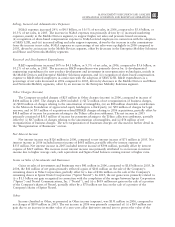
Selling, General and Administrative Expenses
SG&A expenses increased 24% to $4.5 billion, or 10.5% of net sales, in 2006, compared to $3.6 billion, or
10.3% of net sales, in 2005. The increase in SG&A expenses was primarily driven by: (i) increased marketing
expenses, mainly in the Mobile Devices segment, to support higher net sales and promote brand awareness,
(ii) recognition of share-based compensation expense to SG&A-related employees in connection with the adoption
of SFAS 123R, and (iii) increased selling and sales support expenses, driven by the increase in sales commissions
from the increase in net sales. SG&A expenses as a percentage of net sales were up slightly in 2006 compared to
2005, driven by an increase in the Mobile Devices segment, offset by decreases in the Enterprise Mobility Solutions
and Home and Networks Mobility segments.
Research and Development Expenditures
R&D expenditures increased 14% to $4.1 billion, or 9.5% of net sales, in 2006, compared to $3.6 billion, or
10.2% of net sales, in 2005. The increase in R&D expenditures was primarily driven by: (i) developmental
engineering expenditures for new product development and investment in next-generation technologies, mainly in
the Mobile Devices and Enterprise Mobility Solutions segments, and (ii) recognition of share-based compensation
expense to R&D-related employees in connection with the adoption of SFAS 123R. R&D expenditures as a
percentage of net sales decreased in 2006 compared to 2005, driven by decreases in the Mobile Devices and Home
and Networks Mobility segments, offset by an increase in the Enterprise Mobility Solutions segment.
Other Charges (Income)
The Company recorded charges of $25 million in Other charges (income) in 2006, compared to income of
$404 million in 2005. The charges in 2006 included: (i) $172 million of net reorganization of business charges,
(ii) $100 million of charges relating to the amortization of intangibles, (iii) an $88 million charitable contribution
to the Motorola Foundation of appreciated equity holdings in a third party, (iv) $50 million of charges for legal
reserves, and (v) $33 million of acquisition-related IPR&D charges relating to 2006 acquisitions, partially offset by
$418 million of income for payments relating to the Telsim collection settlement. The net income in 2005
primarily consisted of $515 million of income for payments relating to the Telsim collection settlement, partially
offset by: (i) $67 million of charges relating to the amortization of intangibles, and (ii) $54 million of net
reorganization of business charges. The net reorganization of businesses charges are discussed in further detail in
the “Reorganization of Businesses” section.
Net Interest Income
Net interest income was $326 million in 2006, compared to net interest income of $71 million in 2005. Net
interest income in 2006 included interest income of $661 million, partially offset by interest expense of
$335 million. Net interest income in 2005 included interest income of $396 million, partially offset by interest
expense of $325 million. The increase in net interest income was primarily attributed to an increase in interest
income due to higher average cash, cash equivalents and Sigma Fund balances earning interest at higher rates.
Gains on Sales of Investments and Businesses
Gains on sales of investments and businesses were $41 million in 2006, compared to $1.8 billion in 2005. In
2006, the $41 million of net gains primarily reflected a gain of $141 million on the sale of the Company’s
remaining shares in Telus Corporation, partially offset by a loss of $126 million on the sale of the Company’s
remaining shares in Sprint Nextel Corporation (“Sprint Nextel”). In 2005, the net gains were primarily related to:
(i) a $1.3 billion net gain recognized in connection with the completion of the merger between Sprint Corporation
(“Sprint”) and Nextel Communications, Inc. (“Nextel”), and (ii) a $609 million net gain on the sale of a portion
of the Company’s shares of Nextel, partially offset by a $70 million net loss on the sale of a portion of the
Company’s shares of Sprint Nextel.
Other
Income classified as Other, as presented in Other income (expense), was $151 million in 2006, compared to
net charges of $109 million in 2005. The net income in 2006 was primarily comprised of: (i) a $99 million net
gain due to an increase in market value of a zero-cost collar derivative entered into to protect the value of the
45
MANAGEMENT’S DISCUSSION AND ANALYSIS
OF FINANCIAL CONDITION AND RESULTS OF OPERATIONS