Motorola 2007 Annual Report Download - page 45
Download and view the complete annual report
Please find page 45 of the 2007 Motorola annual report below. You can navigate through the pages in the report by either clicking on the pages listed below, or by using the keyword search tool below to find specific information within the annual report.-
 1
1 -
2
-
3
-
4
-
5
-
6
-
7
-
8
-
9
-
10
-
11
-
12
-
13
-
14
-
15
-
16
-
17
-
18
-
19
-
20
-
21
-
22
-
23
-
24
-
25
-
26
-
27
-
28
-
29
-
30
-
31
-
32
-
33
-
34
-
 35
35 -
 36
36 -
 37
37 -
 38
38 -
 39
39 -
 40
40 -
 41
41 -
 42
42 -
 43
43 -
 44
44 -
 45
45 -
 46
46 -
 47
47 -
 48
48 -
 49
49 -
 50
50 -
 51
51 -
 52
52 -
 53
53 -
 54
54 -
 55
55 -
56
-
57
-
58
-
59
-
60
-
61
-
62
-
63
-
64
-
65
-
66
-
67
-
68
-
69
-
70
-
71
-
72
-
73
-
74
-
75
-
76
-
77
-
78
-
79
-
80
-
81
-
82
-
83
-
84
-
85
-
86
-
87
-
88
-
89
-
90
-
91
-
92
-
93
-
94
-
95
-
96
-
97
-
98
-
99
-
100
-
101
-
102
-
103
-
104
-
105
-
106
-
107
-
108
-
109
-
110
-
111
-
112
-
113
-
114
-
115
-
116
-
117
-
118
-
119
-
120
-
121
-
122
-
123
-
124
-
125
-
126
-
127
-
128
-
129
-
130
-
131
-
132
-
133
-
134
-
135
-
136
-
137
-
138
-
139
-
140
-
141
-
142
-
143
-
144
-
145
-
146
 |
 |

Item 7: Management’s Discussion and Analysis of Financial Condition and Results of
Operations
The following is a discussion and analysis of our financial position and results of operations for each of the
three years in the period ended December 31, 2007. This commentary should be read in conjunction with our
consolidated financial statements and the notes thereto which appear beginning under “Item 8: Financial Statements
and Supplementary Data.”
Executive Overview
What businesses are we in?
Motorola reports financial results for the following three operating business segments:
• The Mobile Devices segment designs, manufactures, sells and services wireless handsets with integrated
software and accessory products, and licenses intellectual property. The segment’s net sales in 2007 were
$19.0 billion, representing 52% of the Company’s consolidated net sales.
• The Home and Networks Mobility segment designs, manufactures, sells, installs and services: (i) digital
video, Internet Protocol (“IP”) video and broadcast network interactive set-tops (“digital entertainment
devices”), end-to-end video delivery solutions, broadband access infrastructure systems, and associated data
and voice customer premise equipment (“broadband gateways”) to cable television and telecom service
providers (collectively, referred to as the “home business”), and (ii) wireless access systems (“wireless
networks”), including cellular infrastructure systems and wireless broadband systems, to wireless service
providers. The segment’s net sales in 2007 were $10.0 billion, representing 27% of the Company’s
consolidated net sales.
• The Enterprise Mobility Solutions segment designs, manufactures, sells, installs and services analog and
digital two-way radio, voice and data communications products and systems for private networks, wireless
broadband systems and end-to-end enterprise mobility solutions to a wide range of enterprise markets,
including government and public safety agencies (which, together with all sales for distributors of two-way
communication products, are referred to as the “government and public safety market”), as well as retail,
utility, transportation, manufacturing, healthcare and other commercial customers (which, collectively, are
referred to as the “commercial enterprise market”). The segment’s net sales in 2007 were $7.7 billion,
representing 21% of the Company’s consolidated net sales.
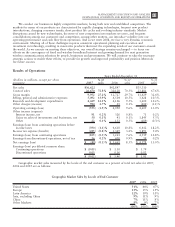
What were our 2007 financial results?
•Net Sales were $36.6 Billion: Our net sales were $36.6 billion in 2007, down 15% compared to net sales
of $42.8 billion in 2006. Net sales decreased 33% in the Mobile Devices segment, increased 9% in the
Home and Networks Mobility segment and increased 43% in the Enterprise Mobility Solutions segment.
•Operating Loss of $553 Million: We incurred an operating loss of $553 million in 2007, compared to
operating earnings of $4.1 billion in 2006. Operating margin was (1.5)% of net sales in 2007, compared to
9.6% of net sales in 2006.
•Loss from Continuing Operations of $105 Million, or $0.05 per Share: We incurred a loss from
continuing operations of $105 million, or $0.05 per diluted common share, in 2007, compared to earnings
from continuing operations of $3.3 billion, or $1.30 per diluted common share, in 2006.
•Operating Cash Flow of $785 Million: We generated operating cash flow of $785 million in 2007,
compared to operating cash flow of $3.5 billion in 2006.
•171.2 Million Shares of Motorola Common Stock Repurchased for $3.0 Billion: During 2007, the
Company repurchased 171.2 million of its common shares for an aggregate cost of $3.0 billion. Since the
inception of its first-ever share repurchase program in May 2005, the Company has repurchased
384.6 million of its common shares for an aggregate cost of $7.7 billion.
37
MANAGEMENT’S DISCUSSION AND ANALYSIS
OF FINANCIAL CONDITION AND RESULTS OF OPERATIONS