Motorola 2005 Annual Report Download - page 96
Download and view the complete annual report
Please find page 96 of the 2005 Motorola annual report below. You can navigate through the pages in the report by either clicking on the pages listed below, or by using the keyword search tool below to find specific information within the annual report.-
 1
1 -
2
-
3
-
4
-
5
-
6
-
7
-
8
-
9
-
10
-
11
-
12
-
13
-
14
-
15
-
16
-
17
-
18
-
19
-
20
-
21
-
22
-
23
-
24
-
25
-
26
-
27
-
28
-
29
-
30
-
31
-
32
-
33
-
34
-
35
-
36
-
37
-
38
-
39
-
40
-
41
-
42
-
43
-
44
-
45
-
46
-
47
-
48
-
49
-
50
-
51
-
52
-
53
-
54
-
55
-
56
-
57
-
58
-
59
-
60
-
61
-
62
-
63
-
64
-
65
-
66
-
67
-
68
-
69
-
70
-
71
-
72
-
73
-
74
-
75
-
76
-
77
-
78
-
79
-
80
-
81
-
82
-
83
-
84
-
85
-
 86
86 -
 87
87 -
 88
88 -
 89
89 -
 90
90 -
 91
91 -
 92
92 -
 93
93 -
 94
94 -
 95
95 -
 96
96 -
 97
97 -
 98
98 -
 99
99 -
 100
100 -
 101
101 -
 102
102 -
 103
103 -
 104
104 -
 105
105 -
 106
106 -
107
-
108
-
109
-
110
-
111
-
112
-
113
-
114
-
115
-
116
-
117
-
118
-
119
-
120
-
121
-
122
-
123
-
124
-
125
-
126
-
127
-
128
-
129
-
130
-
131
-
132
-
133
-
134
-
135
-
136
-
137
-
138
-
139
-
140
-
141
-
142
 |
 |

89
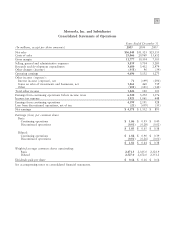
Earnings Per Common Share
The following table presents the computation of the basic and diluted earnings per common share from both
continuing operations and net earnings, which includes discontinued operations:
Continuing Operations Net Earnings
Years Ended December 31
2005
2004 2003
2005
2004 2003
Basic earnings per common share:
Earnings $ 4,599 $ 2,191 $ 928 $ 4,578 $ 1,532 $ 893
Weighted average common shares outstanding 2,471.3 2,365.0 2,321.9 2,471.3 2,365.0 2,321.9
Per share amount $ 1.86 $ 0.93 $ 0.40 $ 1.85 $ 0.65 $ 0.38
Diluted earnings per common share:
Earnings $ 4,599 $ 2,191 $ 928 $ 4,578 $ 1,532 $ 893
Add: Interest on equity security units, net Ì42ÌÌ42 Ì
Earnings, as adjusted $ 4,599 $ 2,233 $ 928 $ 4,578 $ 1,574 $ 893
Weighted average common shares outstanding 2,471.3 2,365.0 2,321.9 2,471.3 2,365.0 2,321.9
Add effect of dilutive securities:
Stock options/restricted stock 55.7 48.8 26.7 55.7 48.8 26.7
Equity security units Ì57.8 Ì Ì57.8 Ì
Zero coupon notes due 2009 and 2013 Ì0.4 2.6 Ì0.4 2.6
Diluted weighted average common shares
outstanding 2,527.0 2,472.0 2,351.2 2,527.0 2,472.0 2,351.2
Per share amount $ 1.82 $ 0.90 $ 0.39 $ 1.81 $ 0.64 $ 0.38
In the computation of diluted earnings per common share from both continuing operations and on a net
earnings basis for the year ended December 31, 2005, the assumed conversion of 44.8 million stock options were
excluded because their inclusion would have been antidilutive. In the computation of diluted earnings per common
share from both continuing operations and on a net earnings basis for the year ended December 31, 2004, the
assumed conversion of 155.8 million stock options were excluded because their inclusion would have been
antidilutive. In the computation of diluted earnings per common share from both continuing operations and on a
net earnings basis for the year ended December 31, 2003, the assumed conversions of the zero coupon notes due
2009, equity security units and 200.9 million stock options were excluded because their inclusion would have been
antidilutive.
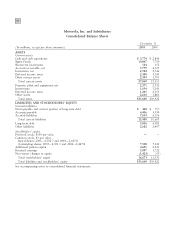
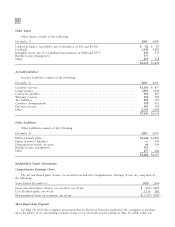
Balance Sheet Information
Accounts Receivable
Accounts Receivable, net, consists of the following:
December 31
2005
2004
Accounts receivable $ 5,885 $ 4,707
Less allowance for doubtful accounts (106) (182)
$ 5,779 $ 4,525
Inventories
Inventories, net, consist of the following:
December 31
2005
2004
Finished goods $ 1,287 $ 1,429
Work-in-process and production materials 1,784 1,665
3,071 3,094
Less inventory reserves (549) (548)
$ 2,522 $ 2,546