Motorola 2005 Annual Report Download - page 67
Download and view the complete annual report
Please find page 67 of the 2005 Motorola annual report below. You can navigate through the pages in the report by either clicking on the pages listed below, or by using the keyword search tool below to find specific information within the annual report.-
 1
1 -
2
-
3
-
4
-
5
-
6
-
7
-
8
-
9
-
10
-
11
-
12
-
13
-
14
-
15
-
16
-
17
-
18
-
19
-
20
-
21
-
22
-
23
-
24
-
25
-
26
-
27
-
28
-
29
-
30
-
31
-
32
-
33
-
34
-
35
-
36
-
37
-
38
-
39
-
40
-
41
-
42
-
43
-
44
-
45
-
46
-
47
-
48
-
49
-
50
-
51
-
52
-
53
-
54
-
55
-
56
-
 57
57 -
 58
58 -
 59
59 -
 60
60 -
 61
61 -
 62
62 -
 63
63 -
 64
64 -
 65
65 -
 66
66 -
 67
67 -
 68
68 -
 69
69 -
 70
70 -
 71
71 -
 72
72 -
 73
73 -
 74
74 -
 75
75 -
 76
76 -
 77
77 -
78
-
79
-
80
-
81
-
82
-
83
-
84
-
85
-
86
-
87
-
88
-
89
-
90
-
91
-
92
-
93
-
94
-
95
-
96
-
97
-
98
-
99
-
100
-
101
-
102
-
103
-
104
-
105
-
106
-
107
-
108
-
109
-
110
-
111
-
112
-
113
-
114
-
115
-
116
-
117
-
118
-
119
-
120
-
121
-
122
-
123
-
124
-
125
-
126
-
127
-
128
-
129
-
130
-
131
-
132
-
133
-
134
-
135
-
136
-
137
-
138
-
139
-
140
-
141
-
142
 |
 |

60 MANAGEMENT'S DISCUSSION AND ANALYSIS
OF FINANCIAL CONDITION AND RESULTS OF OPERATIONS
Segment Information
The following commentary should be read in conjunction with the financial results of each reporting segment
as detailed in Note 10, ""Information by Segment and Geographic Region,'' to the Company's consolidated financial
statements. Net sales and operating results for the Company's four operating segments for 2005, 2004 and 2003 are
presented below.
Mobile Devices Segment
The Mobile Devices segment designs, manufactures, sells and services wireless handsets, with integrated
software and accessory products. In 2005, Mobile Devices' net sales represented 58% of the Company's
consolidated net sales, compared to 55% in 2004 and 49% in 2003.
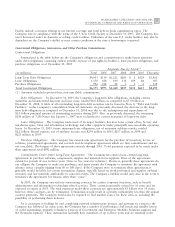
Years Ended December 31 Percent Change
(Dollars in millions)
2005
2004 2003
2005Ì2004
2004Ì2003
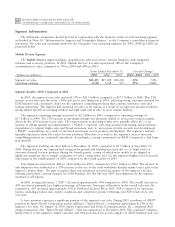
Segment net sales $21,455 $17,108 $11,238 25% 52%
Operating earnings 2,198 1,728 511 27% 238%
Segment ResultsÌ2005 Compared to 2004
In 2005, the segment's net sales increased 25% to $21.5 billion, compared to $17.1 billion in 2004. This 25%
increase in net sales was driven by a 40% increase in unit shipments in 2005, reflecting strong consumer demand for
GSM handsets and consumers' desire for the segment's compelling products that combine innovative style and
leading technology. The segment had increased net sales in all regions as a result of an improved product portfolio,
strong market growth in emerging markets and high replacement sales in more mature markets.
The segment's operating earnings increased to $2.2 billion in 2005, compared to operating earnings of
$1.7 billion in 2004. The 27% increase in operating earnings was primarily related to an increase in gross margin,
driven by the 25% increase in net sales. The improvements in operating results were partially offset by: (i) an
increase in selling, general and administrative (""SG&A'') expenses, reflecting increased advertising and promotion
expenditures to support higher sales and brand awareness, and (ii) an increase in total research and development
(""R&D'') expenditures, as a result of increased investment in new product development. The segment's industry
typically experiences short life cycles for new products. Therefore, it is vital to the segment's success that new,
compelling products are constantly introduced. Accordingly, a strong commitment to R&D is required to fuel long-
term growth.
The segment's backlog was $3.0 billion at December 31, 2005, compared to $1.5 billion at December 31,
2004. During the year, the segment had strong order growth and backlog increased due to: (i) high levels of
customer demand for new products during the fourth quarter, certain of which were unable to be shipped in
significant quantities due to supply constraints for select components, and (ii) the segment's higher level of general
order input in the fourth quarter of 2005 compared to the fourth quarter of 2004.
Unit shipments increased by 40% to 146.0 million in 2005, compared to 104.5 million in 2004. The increase in
unit shipments was attributed to a 17% increase in the size of the total worldwide handset market and a gain in the
segment's market share. The gain in market share was attributed to broad acceptance of the segment's product
offering, particularly a strong demand for GSM handsets. For the full year 2005, unit shipments by the segment
increased in all regions.
In 2005, average sales price (""ASP'') decreased approximately 10% compared to 2004. The overall decrease in
ASP was driven primarily by a higher percentage of lower-tier, lower-priced handsets in the overall sales mix. By
comparison, ASP increased approximately 15% in 2004 and declined 8% in 2003. ASP is impacted by numerous
factors, including product mix, market conditions and competitive product offerings, and ASP trends often vary
over time.
A few customers represent a significant portion of the segment's net sales. During 2005, purchases of iDEN»
products by Sprint Nextel Corporation and its affiliates (""Sprint Nextel'') comprised approximately 13% of the
segment's net sales. On August 12, 2005, Sprint Corporation and Nextel Communications, Inc. completed their
merger transaction (the ""Sprint Nextel Merger'') that was announced in December 2004. The combined company,
Sprint Nextel, is the segment's largest customer and Motorola has been its sole supplier of iDEN handsets and core