Motorola 2005 Annual Report Download - page 70
Download and view the complete annual report
Please find page 70 of the 2005 Motorola annual report below. You can navigate through the pages in the report by either clicking on the pages listed below, or by using the keyword search tool below to find specific information within the annual report.-
 1
1 -
2
-
3
-
4
-
5
-
6
-
7
-
8
-
9
-
10
-
11
-
12
-
13
-
14
-
15
-
16
-
17
-
18
-
19
-
20
-
21
-
22
-
23
-
24
-
25
-
26
-
27
-
28
-
29
-
30
-
31
-
32
-
33
-
34
-
35
-
36
-
37
-
38
-
39
-
40
-
41
-
42
-
43
-
44
-
45
-
46
-
47
-
48
-
49
-
50
-
51
-
52
-
53
-
54
-
55
-
56
-
57
-
58
-
59
-
 60
60 -
 61
61 -
 62
62 -
 63
63 -
 64
64 -
 65
65 -
 66
66 -
 67
67 -
 68
68 -
 69
69 -
 70
70 -
 71
71 -
 72
72 -
 73
73 -
 74
74 -
 75
75 -
 76
76 -
 77
77 -
 78
78 -
 79
79 -
 80
80 -
81
-
82
-
83
-
84
-
85
-
86
-
87
-
88
-
89
-
90
-
91
-
92
-
93
-
94
-
95
-
96
-
97
-
98
-
99
-
100
-
101
-
102
-
103
-
104
-
105
-
106
-
107
-
108
-
109
-
110
-
111
-
112
-
113
-
114
-
115
-
116
-
117
-
118
-
119
-
120
-
121
-
122
-
123
-
124
-
125
-
126
-
127
-
128
-
129
-
130
-
131
-
132
-
133
-
134
-
135
-
136
-
137
-
138
-
139
-
140
-
141
-
142
 |
 |

63
MANAGEMENT'S DISCUSSION AND ANALYSIS
OF FINANCIAL CONDITION AND RESULTS OF OPERATIONS
enhanced mission-critical communications and the continued focus on homeland security initiatives, (ii) increased
spending by the segment's enterprise customers on business-critical communications needs, and (iii) an increase in
automative-related sales. The overall increase in net sales reflected net sales growth in all regions.
The segment's operating earnings increased to $842 million in 2004, compared to operating earnings of
$663 million in 2003. The 27% increase in operating earnings was primarily due to: (i) the 12% increase in net
sales, (ii) cost savings from supply-chain efficiencies, and (iii) overall cost structure improvements. Also
contributing to the increase in operating earnings was a decrease in reorganization of business charges, primarily due
to a decrease in charges related to segment-wide employee severance. These improvements in operating results were
partially offset by: (i) an increase in R&D expenditures driven by increased investment in new technologies, (ii) an
increase in SG&A expenditures, primarily due to an increase in selling and sales support expenditures, resulting
from the 12% increase in net sales, and (iii) $17 million of in-process research and development charges related to
the acquisitions of MeshNetworks, Inc. (""MeshNetworks'') and CRISNET, Inc. (""CRISNET'')
Net sales in North America continued to comprise a significant portion of the segment's business, accounting
for 67% of the segment's net sales in both 2004 and 2003. The segment's backlog was $2.4 billion at December 31,
2004, compared to $2.0 billion at December 31, 2003. The increase in backlog at the end of 2004 was driven by
the awarding of large, multi-year projects in the segment's government market during the latter half of 2004.
In the fourth quarter of 2004, the Company completed the acquisitions of MeshNetworks and CRISNET.
MeshNetworks is a leading developer of mobile mesh networking and position-location technologies. CRISNET has
a suite of advanced software applications for law enforcement, justice and public safety agencies.
Networks Segment
The Networks segment designs, manufactures, sells, installs and services: (i) cellular infrastructure systems,
including hardware and software, (ii) fiber-to-the-premise (""FTTP'') and fiber-to-the-node (""FTTN'')
transmission systems supporting high-speed data, video and voice, and (iii) wireless broadband systems. In addition,
the segment designs, manufactures, and sells embedded communications computing platforms. In 2005, the
segment's net sales represented 17% of the Company's consolidated net sales compared to 19% in 2004 and 21% in
2003.
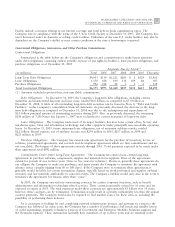
Years Ended December 31 Percent Change
(Dollars in millions)
2005
2004 2003
2005Ì2004
2004Ì2003
Segment net sales $6,332 $6,026 $4,846 5% 24%
Operating earnings (loss) 990 718 148 38% 385%
Segment ResultsÌ2005 Compared to 2004
In 2005, the segment's net sales increased 5% to $6.3 billion, compared to $6.0 billion in 2004. The 5%
increase in sales was driven by increased customer purchases of cellular infrastructure equipment, as well as
increased sales of wireless broadband systems and embedded computing communications systems. On a geographic
basis, net sales increased in the Europe, Middle East and Africa region (""EMEA'') and North America, which
offset lower sales in Asia and Latin America. Sales into non-U.S. markets represented approximately 58% of the
segment's total net sales in 2005, compared to approximately 66% in 2004. The segment's backlog was $2.0 billion
at both December 31, 2005, and December 31, 2004.
The segment's operating earnings increased to $990 million in 2005, compared to operating earnings of
$718 million in 2004. The 38% increase in operating earnings was primarily related to an increase in gross margin, which
was due to: (i) the 5% increase in net sales, and (ii) improvements in cost structure. These improvements in operating
results were partially offset by an increase in SG&A expenditures, primarily due to increased selling and sales support
expenditures, as a result of the 5% increase in net sales. R&D expenditures also increased compared to 2004, due to
additional investment in the growth businesses of wireless broadband systems and passive optical networks.
The cellular infrastructure industry experienced its second straight year of growth in 2005, with estimated
worldwide industry growth of 10%. The segment's 5% increase in net sales was reflective of the overall sales growth
in the industry, yet resulted in a slight loss of market share for the segment in 2005.