Motorola 2005 Annual Report Download - page 49
Download and view the complete annual report
Please find page 49 of the 2005 Motorola annual report below. You can navigate through the pages in the report by either clicking on the pages listed below, or by using the keyword search tool below to find specific information within the annual report.-
 1
1 -
2
-
3
-
4
-
5
-
6
-
7
-
8
-
9
-
10
-
11
-
12
-
13
-
14
-
15
-
16
-
17
-
18
-
19
-
20
-
21
-
22
-
23
-
24
-
25
-
26
-
27
-
28
-
29
-
30
-
31
-
32
-
33
-
34
-
35
-
36
-
37
-
38
-
 39
39 -
 40
40 -
 41
41 -
 42
42 -
 43
43 -
 44
44 -
 45
45 -
 46
46 -
 47
47 -
 48
48 -
 49
49 -
 50
50 -
 51
51 -
 52
52 -
 53
53 -
 54
54 -
 55
55 -
 56
56 -
 57
57 -
 58
58 -
 59
59 -
60
-
61
-
62
-
63
-
64
-
65
-
66
-
67
-
68
-
69
-
70
-
71
-
72
-
73
-
74
-
75
-
76
-
77
-
78
-
79
-
80
-
81
-
82
-
83
-
84
-
85
-
86
-
87
-
88
-
89
-
90
-
91
-
92
-
93
-
94
-
95
-
96
-
97
-
98
-
99
-
100
-
101
-
102
-
103
-
104
-
105
-
106
-
107
-
108
-
109
-
110
-
111
-
112
-
113
-
114
-
115
-
116
-
117
-
118
-
119
-
120
-
121
-
122
-
123
-
124
-
125
-
126
-
127
-
128
-
129
-
130
-
131
-
132
-
133
-
134
-
135
-
136
-
137
-
138
-
139
-
140
-
141
-
142
 |
 |

42 MANAGEMENT'S DISCUSSION AND ANALYSIS
OF FINANCIAL CONDITION AND RESULTS OF OPERATIONS
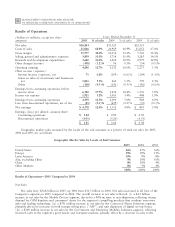
Results of Operations
Years Ended December 31
(Dollars in millions, except per share
amounts)
2005 % of sales
2004 % of sales 2003 % of sales
Net sales $36,843 $31,323 $23,155
Costs of sales 25,066 68.0% 20,969 66.9% 15,652 67.6%
Gross margin 11,777 32.0% 10,354 33.1% 7,503 32.4%
Selling, general and administrative expenses 3,859 10.5% 3,714 11.9% 3,285 14.1%
Research and development expenditures 3,680 10.0% 3,412 10.9% 2,979 12.9%
Other charges(income) (458) (1.2)% 96 0.3% (34) (0.1)%
Operating earnings 4,696 12.7% 3,132 10.0% 1,273 5.5%
Other income (expense):
Interest income (expense), net 71 0.2% (199) (0.6)% (294) (1.3)%
Gains on sales of investments and businesses,
net 1,861 5.1% 460 1.5% 539 2.3%
Other (108) (0.3)% (141) (0.5)% (142) (0.6)%
Earnings from continuing operations before
income taxes 6,520 17.7% 3,252 10.4% 1,376 5.9%
Income tax expense 1,921 5.2% 1,061 3.4% 448 1.9%
Earnings from continuing operations 4,599 12.5% 2,191 7.0% 928 4.0%
Loss from discontinued operations, net of tax (21) (0.1)% (659) (2.1)% (35) (0.1)%
Net earnings $ 4,578 12.4% $ 1,532 4.9% $ 893 3.9%
Earnings (loss) per diluted common share:
Continuing operations $ 1.82 $ 0.90 $ 0.39
Discontinued operations (0.01) (0.26) (0.01)
$ 1.81 $ 0.64 $ 0.38
Geographic market sales measured by the locale of the end customer as a percent of total net sales for 2005,
2004 and 2003 are as follows:
Geographic Market Sales by Locale of End Customer
2005
2004 2003
United States 46% 47% 56%
Europe 19% 19% 13%
Latin America 10% 9% 8%
Asia, excluding China 9% 10% 10%
China 8% 10% 9%
Other Markets 8% 5% 4%
100% 100% 100%
Results of OperationsÌ2005 Compared to 2004
Net Sales
Net sales were $36.8 billion in 2005, up 18% from $31.3 billion in 2004. Net sales increased in all four of the
Company's segments in 2005 compared to 2004. The overall increase in net sales reflected: (i) a $4.3 billion
increase in net sales by the Mobile Devices segment, driven by a 40% increase in unit shipments, reflecting strong
demand for GSM handsets and consumers' desire for the segment's compelling products that combine innovative
style and leading technology, (ii) a $551 million increase in net sales by the Connected Home Solutions segment,
primarily driven by increases in both average selling price (""ASP'') and unit shipments of digital set-top boxes,
(iii) a $369 million increase in net sales by the Government and Enterprise Mobility Solutions segment, reflecting
increased sales to the segment's government and enterprise markets, partially offset by a decrease in sales to the