Motorola 2005 Annual Report Download - page 51
Download and view the complete annual report
Please find page 51 of the 2005 Motorola annual report below. You can navigate through the pages in the report by either clicking on the pages listed below, or by using the keyword search tool below to find specific information within the annual report.-
 1
1 -
2
-
3
-
4
-
5
-
6
-
7
-
8
-
9
-
10
-
11
-
12
-
13
-
14
-
15
-
16
-
17
-
18
-
19
-
20
-
21
-
22
-
23
-
24
-
25
-
26
-
27
-
28
-
29
-
30
-
31
-
32
-
33
-
34
-
35
-
36
-
37
-
38
-
39
-
40
-
 41
41 -
 42
42 -
 43
43 -
 44
44 -
 45
45 -
 46
46 -
 47
47 -
 48
48 -
 49
49 -
 50
50 -
 51
51 -
 52
52 -
 53
53 -
 54
54 -
 55
55 -
 56
56 -
 57
57 -
 58
58 -
 59
59 -
 60
60 -
 61
61 -
62
-
63
-
64
-
65
-
66
-
67
-
68
-
69
-
70
-
71
-
72
-
73
-
74
-
75
-
76
-
77
-
78
-
79
-
80
-
81
-
82
-
83
-
84
-
85
-
86
-
87
-
88
-
89
-
90
-
91
-
92
-
93
-
94
-
95
-
96
-
97
-
98
-
99
-
100
-
101
-
102
-
103
-
104
-
105
-
106
-
107
-
108
-
109
-
110
-
111
-
112
-
113
-
114
-
115
-
116
-
117
-
118
-
119
-
120
-
121
-
122
-
123
-
124
-
125
-
126
-
127
-
128
-
129
-
130
-
131
-
132
-
133
-
134
-
135
-
136
-
137
-
138
-
139
-
140
-
141
-
142
 |
 |

44 MANAGEMENT'S DISCUSSION AND ANALYSIS
OF FINANCIAL CONDITION AND RESULTS OF OPERATIONS
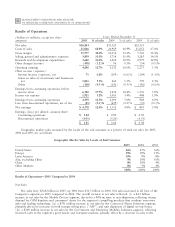
Net Interest Income (Expense)
Net interest income was $71 million in 2005, compared to net interest expense of $199 million in 2004. The
Company generated net interest income in 2005 and the Company currently expects to have net interest income in
2006 as well. Net interest income in 2005 included interest income of $396 million, partially offset by interest
expense of $325 million. Net interest expense in 2004 included interest expense of $353 million, partially offset by
interest income of $154 million. The increase in net interest income in 2005 compared to 2004 reflects: (i) an
increase in interest income due primarily to higher average cash, cash equivalents and Sigma Funds balances at
higher interest rates, and (ii) the significantly lower levels of total debt in 2005 compared to 2004.
Gains on Sales of Investments and Businesses
Gains on sales of investments and businesses were $1.9 billion in 2005, compared to $460 million in 2004. The
2005 net gains were primarily: (i) a $1.3 billion net gain recognized when the Company received 69.3 million
shares of Sprint Nextel Corporation (""Sprint Nextel''), as well as $46 million in cash, in exchange for the
Company's shares of Nextel Communications, Inc. (""Nextel'') when Sprint Corporation and Nextel completed
their merger in August 2005, and (ii) a $609 million net gain recognized on the sale of a portion of the Company's
shares in Nextel during the first half of 2005. These gains were partially offset by a net loss of $70 million on the
sale of a portion of the Company's shares in Sprint Nextel in the fourth quarter of 2005.
The 2004 net gains were primarily: (i) a $130 million gain on the sale of the Company's remaining shares in
Broadcom Corporation, (ii) a $122 million gain on the sale of a portion of the Company's shares in Nextel,
(iii) an $82 million gain on the sale of a portion of the Company's shares in Telus Corporation, and (iv) a
$68 million gain on the sale of a portion of the Company's shares in Nextel Partners, Inc. (""Nextel Partners'')
Other
Charges classified as Other, as presented in Other income (expense), were $108 million in 2005, compared to
$141 million in 2004. The $108 million of net charges in 2005 primarily were (i) $137 million of debt retirement
costs, (ii) foreign currency losses of $38 million, and (iii) $25 million of investment impairment charges. These
items were partially offset by: (i) $51 million in income recognized in connection with a derivative relating to a
portion of the Company's investment in Sprint Nextel, and (ii) $30 million in income from the repayment of a
previously-reserved loan related to Iridium.
The $141 million of net charges in 2004 primarily were: (i) charges of $81 million for costs related to the
redemption of debt, (ii) foreign currency losses of $44 million, and (iii) $36 million of investment impairment
charges.
Effective Tax Rate
The effective tax rate was 29% in 2005, representing a $1.9 billion net tax expense, compared to a 33%
effective tax rate in 2004, representing a $1.1 billion net tax expense. The 2005 tax rate reflects a $265 million net
tax benefit related to the repatriation of foreign earnings under the provisions of the American Jobs Creation Act of
2004 and an $81 million net tax benefit on the stock sale of a sensor business that was divested in 2005.
The 2004 effective tax rate reflects a $241 million benefit from the reversal of previously-accrued income taxes
as the result of settlements reached with taxing authorities and a reassessment of tax exposures based on the status
of current audits, offset by nondeductible charges of $125 million for goodwill impairment related to a sensor
business that was divested in 2005 and $31 million for in-process research and development (""IPR&D'') charges
related to acquisitions.
Earnings from Continuing Operations
The Company had earnings from continuing operations before income taxes of $6.5 billion in 2005, compared
to earnings from continuing operations before income taxes of $3.3 billion in 2004. After taxes, the Company had
earnings from continuing operations of $4.6 billion, or $1.82 per diluted share from continuing operations, in 2005,
compared to earnings from continuing operations of $2.2 billion, or $0.90 per diluted share from continuing
operations, in 2004.