Motorola 2005 Annual Report Download - page 89
Download and view the complete annual report
Please find page 89 of the 2005 Motorola annual report below. You can navigate through the pages in the report by either clicking on the pages listed below, or by using the keyword search tool below to find specific information within the annual report.-
 1
1 -
2
-
3
-
4
-
5
-
6
-
7
-
8
-
9
-
10
-
11
-
12
-
13
-
14
-
15
-
16
-
17
-
18
-
19
-
20
-
21
-
22
-
23
-
24
-
25
-
26
-
27
-
28
-
29
-
30
-
31
-
32
-
33
-
34
-
35
-
36
-
37
-
38
-
39
-
40
-
41
-
42
-
43
-
44
-
45
-
46
-
47
-
48
-
49
-
50
-
51
-
52
-
53
-
54
-
55
-
56
-
57
-
58
-
59
-
60
-
61
-
62
-
63
-
64
-
65
-
66
-
67
-
68
-
69
-
70
-
71
-
72
-
73
-
74
-
75
-
76
-
77
-
78
-
 79
79 -
 80
80 -
 81
81 -
 82
82 -
 83
83 -
 84
84 -
 85
85 -
 86
86 -
 87
87 -
 88
88 -
 89
89 -
 90
90 -
 91
91 -
 92
92 -
 93
93 -
 94
94 -
 95
95 -
 96
96 -
 97
97 -
 98
98 -
 99
99 -
100
-
101
-
102
-
103
-
104
-
105
-
106
-
107
-
108
-
109
-
110
-
111
-
112
-
113
-
114
-
115
-
116
-
117
-
118
-
119
-
120
-
121
-
122
-
123
-
124
-
125
-
126
-
127
-
128
-
129
-
130
-
131
-
132
-
133
-
134
-
135
-
136
-
137
-
138
-
139
-
140
-
141
-
142
 |
 |

82
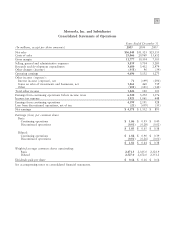
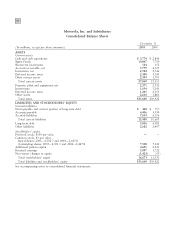
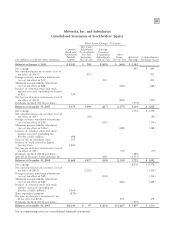
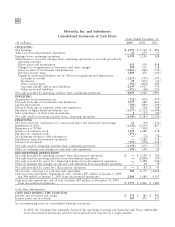
Motorola, Inc. and Subsidiaries
Consolidated Statements of Cash Flows Years Ended December 31
(In millions)
2005
2004 2003
OPERATING
Net Earnings $ 4,578 $ 1,532 $ 893
Add: Loss from discontinued operations 21 659 35
Earnings from continuing operations 4,599 2,191 928
Adjustments to reconcile earnings from continuing operations to net cash provided by
operating activities:
Depreciation and amortization 613 659 818
Charges for reorganization of businesses and other charges 209 151 158
Gains on sales of investments and businesses (1,861) (460) (539)
Deferred income taxes 1,000 456 (160)
Change in assets and liabilities, net of effects of acquisitions and dispositions:
Accounts receivable (1,251) (539) (141)
Inventories 23 (433) (34)
Other current assets (703) (808) 109
Accounts payable and accrued liabilities 2,347 1,917 576
Other assets and liabilities (371) (68) 276
Net cash provided by operating activities from continuing operations 4,605 3,066 1,991
INVESTING
Acquisitions and investments, net (312) (476) (279)
Proceeds from sale of investments and businesses 1,557 682 665
Capital expenditures (583) (494) (344)
Proceeds from sale of property, plant and equipment 103 138 104
Purchases of Sigma Funds investments, net (3,157) (1,522) (6,188)
Sales (purchases) of short-term investments 8(13) (82)
Net cash used for investing activities from continuing operations (2,384) (1,685) (6,124)
FINANCING
Net proceeds from (repayment of) commercial paper and short-term borrowings 11 (19) (234)
Repayment of debt (1,132) (2,250) (827)
Repayment of TOPrS Ì(500) Ì
Issuance of common stock 1,199 1,680 158
Purchase of common stock (874) ÌÌ
Net payments related to debt redemption Ì(52) (78)
Distribution from discontinued operations Ì1,282 556
Payment of dividends (394) (378) (332)
Net cash used for financing activities from continuing operations (1,190) (237) (757)
Effect of exchange rate changes on cash and cash equivalents (103) 100 29
DISCONTINUED OPERATIONS*
Net cash provided by operating activities from discontinued operations $Ì$ 1,199 $ 796
Net cash used for investing activities from discontinued operations Ì(2,848) (87)
Net cash provided by (used for) financing activities from discontinued operations Ì1,498 (724)
Effect of exchange rate changes on cash and cash equivalents from discontinued operations Ì64 58
Net cash provided by (used for) discontinued operations $Ì$ (87) $ 43
Net increase (decrease) in cash and cash equivalents 928 1,157 (4,818)
Cash and cash equivalents, beginning of year (includes $87 million at January 1, 2004
and $44 million at January 1, 2003 from discontinued operations) 2,846 1,689 6,507
Cash and cash equivalents, end of year (includes $87 million at December 31, 2003
from discontinued operations) $ 3,774 $ 2,846 $ 1,689
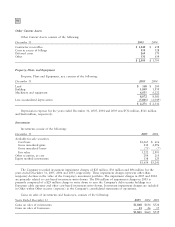
Cash Flow Information
CASH PAID DURING THE YEAR FOR:
Interest, net of interest rate swaps $ 318 $ 381 $ 442
Income taxes, net of refunds 693 471 435
See accompanying notes to consolidated financial statements.
* In 2005, the Company has separately disclosed the operating, investing and financing cash flows attributable
to its discontinued operations, which in prior periods were reported as a single amount.