Motorola 2005 Annual Report Download - page 86
Download and view the complete annual report
Please find page 86 of the 2005 Motorola annual report below. You can navigate through the pages in the report by either clicking on the pages listed below, or by using the keyword search tool below to find specific information within the annual report.-
 1
1 -
2
-
3
-
4
-
5
-
6
-
7
-
8
-
9
-
10
-
11
-
12
-
13
-
14
-
15
-
16
-
17
-
18
-
19
-
20
-
21
-
22
-
23
-
24
-
25
-
26
-
27
-
28
-
29
-
30
-
31
-
32
-
33
-
34
-
35
-
36
-
37
-
38
-
39
-
40
-
41
-
42
-
43
-
44
-
45
-
46
-
47
-
48
-
49
-
50
-
51
-
52
-
53
-
54
-
55
-
56
-
57
-
58
-
59
-
60
-
61
-
62
-
63
-
64
-
65
-
66
-
67
-
68
-
69
-
70
-
71
-
72
-
73
-
74
-
75
-
 76
76 -
 77
77 -
 78
78 -
 79
79 -
 80
80 -
 81
81 -
 82
82 -
 83
83 -
 84
84 -
 85
85 -
 86
86 -
 87
87 -
 88
88 -
 89
89 -
 90
90 -
 91
91 -
 92
92 -
 93
93 -
 94
94 -
 95
95 -
 96
96 -
97
-
98
-
99
-
100
-
101
-
102
-
103
-
104
-
105
-
106
-
107
-
108
-
109
-
110
-
111
-
112
-
113
-
114
-
115
-
116
-
117
-
118
-
119
-
120
-
121
-
122
-
123
-
124
-
125
-
126
-
127
-
128
-
129
-
130
-
131
-
132
-
133
-
134
-
135
-
136
-
137
-
138
-
139
-
140
-
141
-
142
 |
 |

79
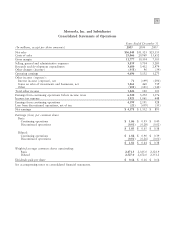
Motorola, Inc. and Subsidiaries
Consolidated Statements of Operations
Years Ended December 31
(In millions, except per share amounts)
2005
2004 2003
Net sales $36,843 $31,323 $23,155
Costs of sales 25,066 20,969 15,652
Gross margin 11,777 10,354 7,503
Selling, general and administrative expenses 3,859 3,714 3,285
Research and development expenditures 3,680 3,412 2,979
Other charges (income) (458) 96 (34)
Operating earnings 4,696 3,132 1,273
Other income (expense):
Interest income (expense), net 71 (199) (294)
Gains on sales of investments and businesses, net 1,861 460 539
Other (108) (141) (142)
Total other income 1,824 120 103
Earnings from continuing operations before income taxes 6,520 3,252 1,376
Income tax expense 1,921 1,061 448
Earnings from continuing operations 4,599 2,191 928
Loss from discontinued operations, net of tax (21) (659) (35)
Net earnings $ 4,578 $ 1,532 $ 893
Earnings (loss) per common share:
Basic:
Continuing operations $ 1.86 $ 0.93 $ 0.40
Discontinued operations (0.01) (0.28) (0.02)
$ 1.85 $ 0.65 $ 0.38
Diluted:
Continuing operations $ 1.82 $ 0.90 $ 0.39
Discontinued operations (0.01) (0.26) (0.01)
$ 1.81 $ 0.64 $ 0.38
Weighted average common shares outstanding:
Basic 2,471.3 2,365.0 2,321.9
Diluted 2,527.0 2,472.0 2,351.2
Dividends paid per share $ 0.16 $ 0.16 $ 0.16
See accompanying notes to consolidated financial statements.