Motorola 2005 Annual Report Download - page 52
Download and view the complete annual report
Please find page 52 of the 2005 Motorola annual report below. You can navigate through the pages in the report by either clicking on the pages listed below, or by using the keyword search tool below to find specific information within the annual report.-
 1
1 -
2
-
3
-
4
-
5
-
6
-
7
-
8
-
9
-
10
-
11
-
12
-
13
-
14
-
15
-
16
-
17
-
18
-
19
-
20
-
21
-
22
-
23
-
24
-
25
-
26
-
27
-
28
-
29
-
30
-
31
-
32
-
33
-
34
-
35
-
36
-
37
-
38
-
39
-
40
-
41
-
 42
42 -
 43
43 -
 44
44 -
 45
45 -
 46
46 -
 47
47 -
 48
48 -
 49
49 -
 50
50 -
 51
51 -
 52
52 -
 53
53 -
 54
54 -
 55
55 -
 56
56 -
 57
57 -
 58
58 -
 59
59 -
 60
60 -
 61
61 -
 62
62 -
63
-
64
-
65
-
66
-
67
-
68
-
69
-
70
-
71
-
72
-
73
-
74
-
75
-
76
-
77
-
78
-
79
-
80
-
81
-
82
-
83
-
84
-
85
-
86
-
87
-
88
-
89
-
90
-
91
-
92
-
93
-
94
-
95
-
96
-
97
-
98
-
99
-
100
-
101
-
102
-
103
-
104
-
105
-
106
-
107
-
108
-
109
-
110
-
111
-
112
-
113
-
114
-
115
-
116
-
117
-
118
-
119
-
120
-
121
-
122
-
123
-
124
-
125
-
126
-
127
-
128
-
129
-
130
-
131
-
132
-
133
-
134
-
135
-
136
-
137
-
138
-
139
-
140
-
141
-
142
 |
 |

45
MANAGEMENT'S DISCUSSION AND ANALYSIS
OF FINANCIAL CONDITION AND RESULTS OF OPERATIONS
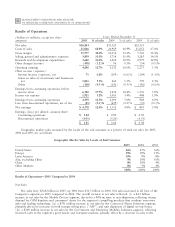
The $3.3 billion increase in earnings from continuing operations before income taxes is primarily attributed to:
(i) a $1.4 billion increase in gains on sales of investments and businesses, due primarily to a $1.3 billion net gain
recognized by the Company when it received cash and shares of Sprint Nextel in exchange for its shares of Nextel
when Sprint and Nextel completed their merger in August 2005, (ii) a $1.4 billion increase in gross margin,
primarily due to the $5.5 billion increase in total net sales, (iii) a $554 million increase in income classified as
Other, primarily due to $500 million received from the settlement of financial and legal claims against Telsim,
(iv) a $270 million increase in net interest income, driven primarily by the reduction in total debt and increased
interest income due to higher average cash, cash equivalents and Sigma Funds balances at higher interest rates, and
(v) a $33 million decrease in Other Charges. These improvements in earnings were partially offset by: (i) a
$268 million increase in R&D expenditures, due primarily to an increase in developmental engineering expenditures
as a result of additional investment in new product development and increased investment in new technologies
across all segments, and (ii) a $145 million increase in SG&A expenditures.
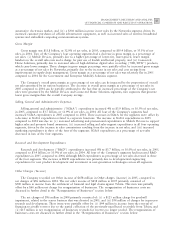
Results of OperationsÌ2004 Compared to 2003
Net Sales
Net sales were $31.3 billion in 2004, up 35% from $23.2 billion in 2003. Net sales increased in all four
segments in 2004 compared to 2003. The overall increase in net sales was primarily related to: (i) a $5.9 billion
increase in net sales by the Mobile Devices segment, primarily driven by a 39% increase in unit shipments, reflecting
strong consumer demand for new products, partially offset by a 15% decrease in ASP, (ii) a $1.2 billion increase in
net sales by the Networks segment, driven by a continued increase in spending by the segment's wireless service
provider customers and reflecting sales growth in all technologies and regions, (iii) a $660 million increase in net
sales by the Government and Enterprise Mobility Solutions segment, reflecting increased spending by customers in
the segment's government, enterprise and automotive markets, and (iv) a $469 million increase in net sales by the
Connected Home Solutions segment, primarily due to increased purchases of digital cable set-top boxes by cable
operators and an increase in ASP for digital set-top boxes due to a mix shift towards higher-end products.
Gross Margin
Gross margin was $10.4 billion, or 33.1% of net sales, in 2004, compared to $7.5 billion, or 32.4% of net sales,
in 2003. All four segments had increased gross margin compared to 2004. Three of the four segments had a higher
gross margin as a percentage of net sales, including: (i) Mobile Devices, primarily due to the increase in net sales
and cost savings from ongoing cost-reduction activities and improvements in supply-chain management,
(ii) Networks, primarily due to the increase in net sales and cost savings from improvements in supply-chain
management, and (iii) Government and Enterprise Mobility Solutions, primarily due to the increase in net sales,
cost savings from supply-chain efficiencies and overall cost structure improvements. These improvements in gross
margin percentage were partially offset by a decrease in gross margin as a percentage of net sales in Connected
Home Solutions, primarily due to higher sales of new, higher-tier products carrying lower initial margins.
Selling, General and Administrative Expenses
SG&A expenditures increased 13% to $3.7 billion, or 11.9% of net sales, in 2004, compared to $3.3 billion, or
14.2% of net sales, in 2003. Three of the Company's four segments had increased SG&A expenditures in 2004
compared to 2003, although SG&A expenditures as percentage of net sales decreased in all four segments. The
increase in SG&A expenditures in 2004 compared to 2003 was due to: (i) increased advertising and promotional
expenditures in Mobile Devices to support higher sales and promote brand awareness, (ii) increased selling and
sales support expenditures in three of the four segments, driven by the increase in sales commissions resulting from
the increase in net sales, and (iii) increased marketing expenditures in all four segments.
Research and Development Expenditures
R&D expenditures increased 15% to $3.4 billion, or 10.9% of net sales, in 2004, compared to $3.0 billion, or
12.9% of net sales, in 2003. All four of the Company's segments had increased R&D expenditures in 2004
compared to 2003, although R&D expenditures as a percentage of net sales decreased in three of the four
segments. The increase in R&D expenditures was primarily due to increased expenditures by: (i) Mobile Devices,
reflecting an increase in developmental engineering expenditures due to additional investment in new product