Motorola 2005 Annual Report Download - page 110
Download and view the complete annual report
Please find page 110 of the 2005 Motorola annual report below. You can navigate through the pages in the report by either clicking on the pages listed below, or by using the keyword search tool below to find specific information within the annual report.-
 1
1 -
2
-
3
-
4
-
5
-
6
-
7
-
8
-
9
-
10
-
11
-
12
-
13
-
14
-
15
-
16
-
17
-
18
-
19
-
20
-
21
-
22
-
23
-
24
-
25
-
26
-
27
-
28
-
29
-
30
-
31
-
32
-
33
-
34
-
35
-
36
-
37
-
38
-
39
-
40
-
41
-
42
-
43
-
44
-
45
-
46
-
47
-
48
-
49
-
50
-
51
-
52
-
53
-
54
-
55
-
56
-
57
-
58
-
59
-
60
-
61
-
62
-
63
-
64
-
65
-
66
-
67
-
68
-
69
-
70
-
71
-
72
-
73
-
74
-
75
-
76
-
77
-
78
-
79
-
80
-
81
-
82
-
83
-
84
-
85
-
86
-
87
-
88
-
89
-
90
-
91
-
92
-
93
-
94
-
95
-
96
-
97
-
98
-
99
-
 100
100 -
 101
101 -
 102
102 -
 103
103 -
 104
104 -
 105
105 -
 106
106 -
 107
107 -
 108
108 -
 109
109 -
 110
110 -
 111
111 -
 112
112 -
 113
113 -
 114
114 -
 115
115 -
 116
116 -
 117
117 -
 118
118 -
 119
119 -
 120
120 -
121
-
122
-
123
-
124
-
125
-
126
-
127
-
128
-
129
-
130
-
131
-
132
-
133
-
134
-
135
-
136
-
137
-
138
-
139
-
140
-
141
-
142
 |
 |

103
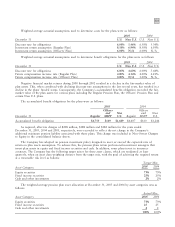
Weighted average actuarial assumptions used to determine costs for the plans were as follows:
2005
2004
December 31
U.S. Non U.S.
U.S. Non U.S.
Discount rate for obligations 6.00% 5.46% 6.50% 5.34%
Investment return assumption (Regular Plan) 8.50% 6.94% 8.50% 6.93%
Investment return assumption (Officers' Plan) 6.00% N/A 6.00% N/A
Weighted average actuarial assumptions used to determine benefit obligations for the plans were as follows:
2005
2004
December 31
U.S. Non U.S.
U.S. Non U.S.
Discount rate for obligations 6.00% 4.60% 6.00% 5.44%
Future compensation increase rate (Regular Plan) 4.00% 4.14% 4.00% 4.21%
Future compensation increase rate (Officers' Plan) 0.00% N/A 3.00% N/A
Negative financial market returns during 2000 through 2002 resulted in a decline in the fair-market value of
plan assets. This, when combined with declining discount rate assumptions in the last several years, has resulted in a
decline in the plans' funded status. Consequently, the Company's accumulated benefits obligation exceeded the fair-
market value of the plan assets for various plans including the Regular Pension Plan, the Officers' Pension Plan and
certain Non U.S. plans.
The accumulated benefit obligations for the plans were as follows:
2005
2004
Officers
Officers
and Non
and Non
December 31
Regular MSPP U.S.
Regular MSPP U.S.
Accumulated benefit obligation $4,759 $149 $1,429 $4,407 $160 $1,244
As required, after-tax charges of $208 million, $188 million and $182 million for the years ended
December 31, 2005, 2004 and 2003, respectively, were recorded to reflect the net change in the Company's
additional minimum pension liability associated with these plans. This change was included in Non-Owner Changes
to Equity in the consolidated balance sheets.
The Company has adopted an pension investment policy designed to meet or exceed the expected rate of
return on plan assets assumption. To achieve this, the pension plans retain professional investment managers that
invest plan assets in equity and fixed income securities and cash. In addition, some plans invest in insurance
contracts. The Company has the following target mixes for these asset classes, which are readjusted at least
quarterly, when an asset class weighting deviates from the target mix, with the goal of achieving the required return
at a reasonable risk level as follows:
Target Mix
2005
2004
Asset Category
Equity securities 73% 73%
Fixed income securities 25% 25%
Cash and other investments 2% 2%
The weighted-average pension plan asset allocation at December 31, 2005 and 2004 by asset categories was as
follows:
Actual Mix
Asset Category
2005
2004
Equity securities 73% 73%
Fixed income securities 25 25
Cash and other investments 22
100% 100%