Motorola 2005 Annual Report Download - page 50
Download and view the complete annual report
Please find page 50 of the 2005 Motorola annual report below. You can navigate through the pages in the report by either clicking on the pages listed below, or by using the keyword search tool below to find specific information within the annual report.-
 1
1 -
2
-
3
-
4
-
5
-
6
-
7
-
8
-
9
-
10
-
11
-
12
-
13
-
14
-
15
-
16
-
17
-
18
-
19
-
20
-
21
-
22
-
23
-
24
-
25
-
26
-
27
-
28
-
29
-
30
-
31
-
32
-
33
-
34
-
35
-
36
-
37
-
38
-
39
-
 40
40 -
 41
41 -
 42
42 -
 43
43 -
 44
44 -
 45
45 -
 46
46 -
 47
47 -
 48
48 -
 49
49 -
 50
50 -
 51
51 -
 52
52 -
 53
53 -
 54
54 -
 55
55 -
 56
56 -
 57
57 -
 58
58 -
 59
59 -
 60
60 -
61
-
62
-
63
-
64
-
65
-
66
-
67
-
68
-
69
-
70
-
71
-
72
-
73
-
74
-
75
-
76
-
77
-
78
-
79
-
80
-
81
-
82
-
83
-
84
-
85
-
86
-
87
-
88
-
89
-
90
-
91
-
92
-
93
-
94
-
95
-
96
-
97
-
98
-
99
-
100
-
101
-
102
-
103
-
104
-
105
-
106
-
107
-
108
-
109
-
110
-
111
-
112
-
113
-
114
-
115
-
116
-
117
-
118
-
119
-
120
-
121
-
122
-
123
-
124
-
125
-
126
-
127
-
128
-
129
-
130
-
131
-
132
-
133
-
134
-
135
-
136
-
137
-
138
-
139
-
140
-
141
-
142
 |
 |

43
MANAGEMENT'S DISCUSSION AND ANALYSIS
OF FINANCIAL CONDITION AND RESULTS OF OPERATIONS
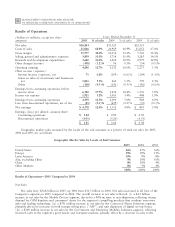
automotive electronics market, and (iv) a $306 million increase in net sales by the Networks segment, driven by
increased customer purchases of cellular infrastructure equipment, as well as increased sales of wireless broadband
systems and embedded computing communications systems.
Gross Margin
Gross margin was $11.8 billion, or 32.0% of net sales, in 2005, compared to $10.4 billion, or 33.1% of net
sales, in 2004. Two of the Company's four operating segments had a decrease in gross margin as a percentage of
net sales: (i) Mobile Devices, primarily due to a higher percentage of lower-tier, lower-priced, lower margin
handsets in the overall sales mix and a charge for past use of Kodak intellectual property, and (ii) Connected
Home Solutions, primarily due to increased sales of high-definition digital video recording (""HD/DVR'') products,
which carry lower margins. These changes in gross margin percentage were partially offset by increased gross margin
as a percentage of net sales by Networks, primarily due to the increase in net sales and cost savings from
improvements in supply-chain management. Gross margin as a percentage of net sales was relatively flat in 2005
compared to 2004 for the Government and Enterprise Mobility Solutions segment.
The Company's overall gross margin as a percentage of net sales can be impacted by the proportion of overall
net sales generated by its various businesses. The decrease in overall gross margin as a percentage of net sales in
2005 compared to 2004 can be partially attributed to the fact that an increased percentage of the Company's net
sales were generated by the Mobile Devices and Connected Home Solutions segments, two segments that generate
lower gross margins than the overall Company average.
Selling, General and Administrative Expenses
Selling, general and administrative (""SG&A'') expenditures increased 4% to $3.9 billion, or 10.5% of net sales,
in 2005, compared to $3.7 billion, or 11.9% of net sales, in 2004. All four of the Company's segments had
increased SG&A expenditures in 2005 compared to 2004. These increases in SG&A for the segments were offset by
a decrease in SG&A expenditures related to corporate functions. The increase in SG&A expenditures in 2005
compared to 2004 was due to: (i) increased advertising and promotional expenditures in Mobile Devices to support
higher sales and promote brand awareness, (ii) increased selling and sales support expenditures in all four operating
segments, driven by the increase in sales commissions resulting from the increase in net sales, and (iii) increased
marketing expenditures in three of the four of the segments. SG&A expenditures as a percentage of net sales
decreased in two of the four segments.
Research and Development Expenditures
Research and development (""R&D'') expenditures increased 8% to $3.7 billion, or 10.0% of net sales, in 2005,
compared to $3.4 billion, or 10.9% of net sales, in 2004. All four of the Company's segments had increased R&D
expenditures in 2005 compared to 2004, although R&D expenditures as percentage of net sales decreased in three
of the four segments. The increase in R&D expenditures was primarily due to developmental engineering
expenditures for new product development and investment in next-generation technologies across all segments.
Other Charges (Income)
The Company recorded net Other income of $458 million in Other charges (income) in 2005, compared to
net charges of $96 million in 2004. The net other income of $458 million in 2005 primarily consisted of
$500 million in income from the settlement of financial and legal claims against Telsim. This item was partially
offset by a $66 million net charge for reorganization of businesses. The reorganization of businesses costs are
discussed in further detail in the ""Reorganization of Businesses'' section below.
The net charges of $96 million in 2004 primarily consisted of: (i) a $125 million charge for goodwill
impairment, related to the sensor business that was divested in 2005, and (ii) $34 million of charges for in-process
research and development. These items were partially offset by: (i) $44 million in income from the reversal of
financing receivable reserves due to the partial collection of the previously-uncollected receivable from Telsim, and
(ii) $15 million in net reorganization of businesses reversals for reserves no longer needed. The reorganization of
businesses costs are discussed in further detail in the ""Reorganization of Businesses'' section below.