Motorola 2005 Annual Report Download - page 73
Download and view the complete annual report
Please find page 73 of the 2005 Motorola annual report below. You can navigate through the pages in the report by either clicking on the pages listed below, or by using the keyword search tool below to find specific information within the annual report.-
 1
1 -
2
-
3
-
4
-
5
-
6
-
7
-
8
-
9
-
10
-
11
-
12
-
13
-
14
-
15
-
16
-
17
-
18
-
19
-
20
-
21
-
22
-
23
-
24
-
25
-
26
-
27
-
28
-
29
-
30
-
31
-
32
-
33
-
34
-
35
-
36
-
37
-
38
-
39
-
40
-
41
-
42
-
43
-
44
-
45
-
46
-
47
-
48
-
49
-
50
-
51
-
52
-
53
-
54
-
55
-
56
-
57
-
58
-
59
-
60
-
61
-
62
-
 63
63 -
 64
64 -
 65
65 -
 66
66 -
 67
67 -
 68
68 -
 69
69 -
 70
70 -
 71
71 -
 72
72 -
 73
73 -
 74
74 -
 75
75 -
 76
76 -
 77
77 -
 78
78 -
 79
79 -
 80
80 -
 81
81 -
 82
82 -
 83
83 -
84
-
85
-
86
-
87
-
88
-
89
-
90
-
91
-
92
-
93
-
94
-
95
-
96
-
97
-
98
-
99
-
100
-
101
-
102
-
103
-
104
-
105
-
106
-
107
-
108
-
109
-
110
-
111
-
112
-
113
-
114
-
115
-
116
-
117
-
118
-
119
-
120
-
121
-
122
-
123
-
124
-
125
-
126
-
127
-
128
-
129
-
130
-
131
-
132
-
133
-
134
-
135
-
136
-
137
-
138
-
139
-
140
-
141
-
142
 |
 |

66 MANAGEMENT'S DISCUSSION AND ANALYSIS
OF FINANCIAL CONDITION AND RESULTS OF OPERATIONS
of digital systems and set-top boxes for cable television, IP video and broadcast networks, enabling the segment to
offer a full range of connected home solutions which enable customers to be seamlessly connected, informed and
entertained.
Segment ResultsÌ2004 Compared to 2003
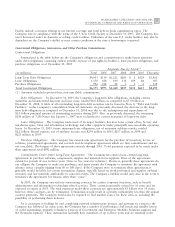
In 2004, the segment's net sales increased 27% to $2.2 billion, compared to $1.7 billion in 2003. The increase
in overall net sales was primarily due to: (i) increased purchases of digital cable set-top boxes by cable operators,
(ii) an increase in ASP due to a mix shift in digital set-top boxes towards higher-end products, and (iii) an increase
in retail sales. The increase in net sales reflects net sales growth in all regions, primarily in North America. Net sales
in North America continued to comprise a significant portion of the segment's business, accounting for 83% of the
segment's total net sales in 2004, compared to 85% in 2003. The segment's backlog was $305 million at
December 31, 2004, compared to $288 million at December 31, 2003.
The segment generated operating earnings of $146 million in 2004, compared to operating earnings of
$48 million in 2003. The improvement in operating results was due to: (i) an increase in gross margin, which was
driven by the 27% increase in net sales, (ii) a $73 million charge for impairment of goodwill related to the
infrastructure business that occurred in 2003, and (iii) a decrease in SG&A expenditures. The decrease in SG&A
expenditures was primarily due to: (i) a decrease in intangible amortization, and (ii) a decrease in administrative
expenses due to benefits from prior cost-reduction actions. Although gross margin increased, the segment's gross
margin as a percentage of net sales decreased, primarily due to sales of new higher-tier products carrying lower
initial margins, which is typical in the early phases of the segment's product life cycles.
In 2004, net sales of digital set-top boxes increased 29%, due to increases in both ASP and unit shipments. The
increase in ASP was driven by a product-mix shift towards higher-end products, particularly HD/DVR set-top
boxes. The increase in unit shipments was primarily due to the increased spending by cable operators. The segment
continued to be the worldwide leader in market share for digital cable set-top boxes.
In 2004, net sales of cable modems increased 20%. The increase in net sales was due to an increase in cable
modem unit shipments, which was partially offset by the decline in ASP for cable modems. The decrease in ASP
was primarily due to increased competition. The segment retained its leading worldwide market share in cable
modems.
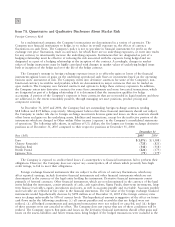
The segment was dependent upon a small number of customers for a significant portion of its sales in 2004.
Because of continuing consolidation within the cable industry, a small number of MSOs own a large portion of the
cable systems and account for a significant portion of the total capital spending. In 2004, net sales to the segment's
top five customers represented 47% of the segment's total net sales. Net sales to the segment's largest customer,
Comcast, accounted for 30% of the total net sales of the segment in 2004.
Significant Accounting Policies
Management's Discussion and Analysis of Financial Condition and Results of Operations discuss the
Company's consolidated financial statements, which have been prepared in accordance with U.S. generally accepted
accounting principles. The preparation of these financial statements requires management to make estimates and
assumptions that affect the reported amounts of assets and liabilities and the disclosure of contingent assets and
liabilities at the date of the financial statements, as well as the reported amounts of revenues and expenses during
the reporting period.
Management bases its estimates and judgments on historical experience, current economic and industry
conditions and on various other factors that are believed to be reasonable under the circumstances. This forms the
basis for making judgments about the carrying values of assets and liabilities that are not readily apparent from
other sources. Actual results may differ from these estimates under different assumptions or conditions.
Management believes the following significant accounting policies require significant judgment and estimates:
Ì Revenue recognition
Ì Allowance for losses on finance receivables
Ì Inventory valuation reserves
Ì Deferred tax asset valuation