Motorola 2005 Annual Report Download - page 44
Download and view the complete annual report
Please find page 44 of the 2005 Motorola annual report below. You can navigate through the pages in the report by either clicking on the pages listed below, or by using the keyword search tool below to find specific information within the annual report.-
 1
1 -
2
-
3
-
4
-
5
-
6
-
7
-
8
-
9
-
10
-
11
-
12
-
13
-
14
-
15
-
16
-
17
-
18
-
19
-
20
-
21
-
22
-
23
-
24
-
25
-
26
-
27
-
28
-
29
-
30
-
31
-
32
-
33
-
 34
34 -
 35
35 -
 36
36 -
 37
37 -
 38
38 -
 39
39 -
 40
40 -
 41
41 -
 42
42 -
 43
43 -
 44
44 -
 45
45 -
 46
46 -
 47
47 -
 48
48 -
 49
49 -
 50
50 -
 51
51 -
 52
52 -
 53
53 -
 54
54 -
55
-
56
-
57
-
58
-
59
-
60
-
61
-
62
-
63
-
64
-
65
-
66
-
67
-
68
-
69
-
70
-
71
-
72
-
73
-
74
-
75
-
76
-
77
-
78
-
79
-
80
-
81
-
82
-
83
-
84
-
85
-
86
-
87
-
88
-
89
-
90
-
91
-
92
-
93
-
94
-
95
-
96
-
97
-
98
-
99
-
100
-
101
-
102
-
103
-
104
-
105
-
106
-
107
-
108
-
109
-
110
-
111
-
112
-
113
-
114
-
115
-
116
-
117
-
118
-
119
-
120
-
121
-
122
-
123
-
124
-
125
-
126
-
127
-
128
-
129
-
130
-
131
-
132
-
133
-
134
-
135
-
136
-
137
-
138
-
139
-
140
-
141
-
142
 |
 |

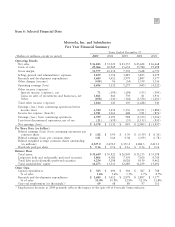
37
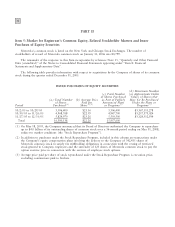
Item 6: Selected Financial Data
Motorola, Inc. and Subsidiaries
Five Year Financial Summary
Years Ended December 31
(Dollars in millions, except as noted)
2005
2004 2003 2002 2001
Operating Results
Net sales $ 36,843 $ 31,323 $ 23,155 $ 23,422 $ 26,468
Costs of sales 25,066 20,969 15,652 15,784 19,698
Gross margin 11,777 10,354 7,503 7,638 6,770
Selling, general and administrative expenses 3,859 3,714 3,285 3,835 4,279
Research and development expenditures 3,680 3,412 2,979 2,887 3,377
Other charges (income) (458) 96 (34) 1,359 3,336
Operating earnings (loss) 4,696 3,132 1,273 (443) (4,222)
Other income (expense):
Interest income (expense), net 71 (199) (294) (355) (390)
Gains on sales of investments and businesses, net 1,861 460 539 81 1,931
Other (108) (141) (142) (1,354) (1,201)
Total other income (expense) 1,824 120 103 (1,628) 340
Earnings (loss) from continuing operations before
income taxes 6,520 3,252 1,376 (2,071) (3,882)
Income tax expense (benefit) 1,921 1,061 448 (721) (876)
Earnings (loss) from continuing operations 4,599 2,191 928 (1,350) (3,006)
Loss from discontinued operations, net of tax (21) (659) (35) (1,135) (931)
Net earnings (loss) $ 4,578 $ 1,532 $ 893 $ (2,485) $ (3,937)
Per Share Data (in dollars)
Diluted earnings (loss) from continuing operations per
common share $ 1.82 $ 0.90 $ 0.39 $ (0.59) $ (1.36)
Diluted earnings (loss) per common share 1.81 0.64 0.38 (1.09) (1.78)
Diluted weighted average common shares outstanding
(in millions) 2,527.0 2,472.0 2,351.2 2,282.3 2,213.3
Dividends paid per share $ 0.16 $ 0.16 $ 0.16 $ 0.16 $ 0.16
Balance Sheet
Total assets $ 35,649 $ 30,922 $ 26,809 $ 31,233 $ 33,398
Long-term debt and redeemable preferred securities 3,806 4,581 7,159 7,660 8,769
Total debt and redeemable preferred securities 4,254 5,298 8,028 9,159 9,462
Total stockholders' equity 16,673 13,331 12,689 11,239 13,691
Other Data
Capital expenditures $ 583 $ 494 $ 344 $ 387 $ 708
% of sales 1.6% 1.6% 1.5% 1.7% 2.7%
Research and development expenditures $ 3,680 $ 3,412 $ 2,979 $ 2,887 $ 3,377
% of sales 10.0% 10.9% 12.9% 12.3% 12.8%
Year-end employment (in thousands)* 69 68 88 97 111
* Employment decrease in 2004 primarily reflects the impact of the spin-off of Freescale Semiconductor.