Motorola 2005 Annual Report Download - page 46
Download and view the complete annual report
Please find page 46 of the 2005 Motorola annual report below. You can navigate through the pages in the report by either clicking on the pages listed below, or by using the keyword search tool below to find specific information within the annual report.-
 1
1 -
2
-
3
-
4
-
5
-
6
-
7
-
8
-
9
-
10
-
11
-
12
-
13
-
14
-
15
-
16
-
17
-
18
-
19
-
20
-
21
-
22
-
23
-
24
-
25
-
26
-
27
-
28
-
29
-
30
-
31
-
32
-
33
-
34
-
35
-
 36
36 -
 37
37 -
 38
38 -
 39
39 -
 40
40 -
 41
41 -
 42
42 -
 43
43 -
 44
44 -
 45
45 -
 46
46 -
 47
47 -
 48
48 -
 49
49 -
 50
50 -
 51
51 -
 52
52 -
 53
53 -
 54
54 -
 55
55 -
 56
56 -
57
-
58
-
59
-
60
-
61
-
62
-
63
-
64
-
65
-
66
-
67
-
68
-
69
-
70
-
71
-
72
-
73
-
74
-
75
-
76
-
77
-
78
-
79
-
80
-
81
-
82
-
83
-
84
-
85
-
86
-
87
-
88
-
89
-
90
-
91
-
92
-
93
-
94
-
95
-
96
-
97
-
98
-
99
-
100
-
101
-
102
-
103
-
104
-
105
-
106
-
107
-
108
-
109
-
110
-
111
-
112
-
113
-
114
-
115
-
116
-
117
-
118
-
119
-
120
-
121
-
122
-
123
-
124
-
125
-
126
-
127
-
128
-
129
-
130
-
131
-
132
-
133
-
134
-
135
-
136
-
137
-
138
-
139
-
140
-
141
-
142
 |
 |

39
MANAGEMENT'S DISCUSSION AND ANALYSIS
OF FINANCIAL CONDITION AND RESULTS OF OPERATIONS
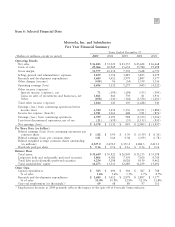
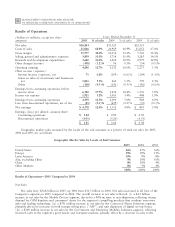
‚Earnings From Continuing Operations of $1.82 per Share: Our earnings from continuing operations per
diluted common share were $1.82 in 2005, compared to earnings from continuing operations per diluted
common share of $0.90 in 2004.
‚Net Cash* Increased by $5.1 Billion: We increased our net cash position by $5.1 billion during 2005 and
ended the year with a record net cash position of $10.5 billion.
What drove the $2.4 billion increase in earnings from continuing operations?
The key contributors to the substantial increase in earnings from continuing operations were:
‚Gross Margin: A $1.4 billion increase in gross margin, primarily driven by the 18% increases in net sales.
‚Recognized Gains on Sales of Investments and Businesses: A $1.4 billion increase in gains recognized on
our equity investments, primarily due to a $1.3 billion net gain recognized when we received cash and
shares of Sprint Nextel Corporation in exchange for our shares of Nextel Communications, Inc.
(""Nextel'') when Sprint Corporation and Nextel completed their merger in August 2005.
‚Other Income: A $554 million increase in other income, primarily due to $500 million received for the
settlement of financial and legal claims against Telsim.
‚Net Interest Income: A $270 million improvement in net interest income, primarily due to significantly
lower levels of total debt in 2005 compared to 2004 and an increase in interest income due to higher
average cash, cash equivalents and Sigma Funds at higher interest rates.
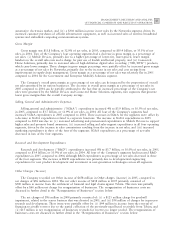
What were the financial highlights for our four operating segments in 2005?
‚In Mobile Devices: Net sales increased by $4.3 billion, or 25%, to $21.5 billion and operating earnings
increased by 27% to $2.2 billion. We shipped 146 million handsets in 2005, up 40% from 2004 and
solidified our position as the second largest worldwide supplier of wireless handsets with an estimated 18%
global market share. The increase in unit shipments was attributed to an increase in the size of the total
market and a gain in the segment's market share. The gain in market share reflected strong demand for
GSM handsets and consumers' desire for the segment's compelling products that combine innovative style
leading technology. The segment had increased net sales in all regions of the world as a result of an
improved product portfolio, strong market growth in emerging markets, and high replacement sales in more
mature markets. Average selling price (""ASP'') decreased approximately 10% compared to 2004, driven
primarily by a higher percentage of lower-tier, lower-priced handsets in the overall sales mix.
‚In Government and Enterprise Mobility Solutions: Net sales increased $369 million, or 6%, to $6.6 billion
and operating earnings increased by 5% to $882, primarily due to increased sales to the segment's
government and enterprise markets, partially offset by a decrease in sales to the automotive electronics
market, reflecting weak automobile industry conditions. The increase in net sales in the government market
was driven by customer spending on enhanced mission-critical communications and the continued focus on
homeland security initiatives. The increase in net sales in the enterprise market reflects enterprise customers'
demand for business-critical communications. The overall increase in net sales reflects net sales growth in
the Americas and Asia.
‚In Networks: Net sales increased $306 million, or 5%, to $6.3 billion and operating earnings increased by
38% to $990 million, primarily driven by increased customer purchases of cellular infrastructure equipment,
as well as increased sales of wireless broadband systems and embedded computing communications systems.
On a geographic basis, net sales increased in the Europe, Middle East and Africa region (""EMEA'') and
North America, which offset lower sales in Asia and Latin America. The segment's 5% increase in net sales
was reflective of the overall sales growth in the industry, yet resulted in a slight loss of market share for the
segment. The 38% increase in operating earnings was primarily related to an increase in gross margin, which
was due to: (i) the 5% increase in net sales, and (ii) improvements in cost structure.
* Net Cash • Cash and cash equivalents ° Sigma Funds ° Short-term investments - Notes payable and current portion of long-term debt -
Long-term Debt