Motorola 2005 Annual Report Download - page 128
Download and view the complete annual report
Please find page 128 of the 2005 Motorola annual report below. You can navigate through the pages in the report by either clicking on the pages listed below, or by using the keyword search tool below to find specific information within the annual report.-
 1
1 -
2
-
3
-
4
-
5
-
6
-
7
-
8
-
9
-
10
-
11
-
12
-
13
-
14
-
15
-
16
-
17
-
18
-
19
-
20
-
21
-
22
-
23
-
24
-
25
-
26
-
27
-
28
-
29
-
30
-
31
-
32
-
33
-
34
-
35
-
36
-
37
-
38
-
39
-
40
-
41
-
42
-
43
-
44
-
45
-
46
-
47
-
48
-
49
-
50
-
51
-
52
-
53
-
54
-
55
-
56
-
57
-
58
-
59
-
60
-
61
-
62
-
63
-
64
-
65
-
66
-
67
-
68
-
69
-
70
-
71
-
72
-
73
-
74
-
75
-
76
-
77
-
78
-
79
-
80
-
81
-
82
-
83
-
84
-
85
-
86
-
87
-
88
-
89
-
90
-
91
-
92
-
93
-
94
-
95
-
96
-
97
-
98
-
99
-
100
-
101
-
102
-
103
-
104
-
105
-
106
-
107
-
108
-
109
-
110
-
111
-
112
-
113
-
114
-
115
-
116
-
117
-
 118
118 -
 119
119 -
 120
120 -
 121
121 -
 122
122 -
 123
123 -
 124
124 -
 125
125 -
 126
126 -
 127
127 -
 128
128 -
 129
129 -
 130
130 -
 131
131 -
 132
132 -
 133
133 -
 134
134 -
 135
135 -
 136
136 -
 137
137 -
 138
138 -
139
-
140
-
141
-
142
 |
 |

121
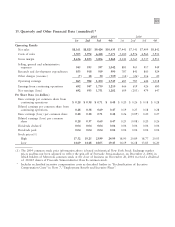
15. Quarterly and Other Financial Data (unaudited)*
2005
2004
1st 2nd 3rd 4th
1st 2nd 3rd 4th
Operating Results
Net sales $8,161 $8,825 $9,424 $10,433 $7,441 $7,541 $7,499 $8,842
Costs of sales 5,505 5,972 6,418 7,171 5,100 4,976 4,962 5,931
Gross margin 2,656 2,853 3,006 3,262 2,341 2,565 2,537 2,911
Selling, general and administrative
expenses 945 935 937 1,042 883 965 917 949
Research and development expenditures 853 918 919 990 787 841 860 924
Other charges (income) (7) 18 50 (519) (14) (26) 116 20
Operating earnings 865 982 1,100 1,749 685 785 644 1,018
Earnings from continuing operations 692 947 1,750 1,210 466 619 426 680
Net earnings (loss) 692 933 1,751 1,202 609 (203) 479 647
Per Share Data (in dollars)
Basic earnings per common share from
continuing operations $ 0.28 $ 0.38 $ 0.71 $ 0.48 $ 0.20 $ 0.26 $ 0.18 $ 0.28
Diluted earnings per common share from
continuing operations 0.28 0.38 0.69 0.47 0.19 0.25 0.18 0.28
Basic earnings (loss) per common share 0.28 0.38 0.71 0.48 0.26 (0.09) 0.20 0.27
Diluted earnings (loss) per common
share 0.28 0.37 0.69 0.47 0.25 (0.08) 0.20 0.26
Dividends declared 0.04 0.04 0.04 0.04 0.04 0.04 0.04 0.04
Dividends paid 0.04 0.04 0.04 0.04 0.04 0.04 0.04 0.04
Stock prices(1)
High 17.52 19.25 23.99 24.99 18.90 20.89 18.77 20.03
Low 14.69 14.48 18.05 19.45 14.19 16.18 13.83 16.20
(1) The 2004 common stock price information above is based on historical New York Stock Exchange market
prices and has not been adjusted to reflect the spin-off of Freescale Semiconductor, on December 2, 2004, in
which holders of Motorola common stock at the close of business on November 26, 2004 received a dividend
of .110415 shares of Freescale Semiconductor Class B common stock.
* Includes reclassified incentive compensation costs as described further in ""Reclassification of Incentive
Compensation Costs'' in Note 7, ""Employment Benefit and Incentive Plans''.