Motorola 2005 Annual Report Download - page 119
Download and view the complete annual report
Please find page 119 of the 2005 Motorola annual report below. You can navigate through the pages in the report by either clicking on the pages listed below, or by using the keyword search tool below to find specific information within the annual report.-
 1
1 -
2
-
3
-
4
-
5
-
6
-
7
-
8
-
9
-
10
-
11
-
12
-
13
-
14
-
15
-
16
-
17
-
18
-
19
-
20
-
21
-
22
-
23
-
24
-
25
-
26
-
27
-
28
-
29
-
30
-
31
-
32
-
33
-
34
-
35
-
36
-
37
-
38
-
39
-
40
-
41
-
42
-
43
-
44
-
45
-
46
-
47
-
48
-
49
-
50
-
51
-
52
-
53
-
54
-
55
-
56
-
57
-
58
-
59
-
60
-
61
-
62
-
63
-
64
-
65
-
66
-
67
-
68
-
69
-
70
-
71
-
72
-
73
-
74
-
75
-
76
-
77
-
78
-
79
-
80
-
81
-
82
-
83
-
84
-
85
-
86
-
87
-
88
-
89
-
90
-
91
-
92
-
93
-
94
-
95
-
96
-
97
-
98
-
99
-
100
-
101
-
102
-
103
-
104
-
105
-
106
-
107
-
108
-
 109
109 -
 110
110 -
 111
111 -
 112
112 -
 113
113 -
 114
114 -
 115
115 -
 116
116 -
 117
117 -
 118
118 -
 119
119 -
 120
120 -
 121
121 -
 122
122 -
 123
123 -
 124
124 -
 125
125 -
 126
126 -
 127
127 -
 128
128 -
 129
129 -
130
-
131
-
132
-
133
-
134
-
135
-
136
-
137
-
138
-
139
-
140
-
141
-
142
 |
 |

112
segment also designs, manufactures and sells automotive electronics systems, as well as telematics systems
that enable communication and advanced safety features for automobiles.
‚ The Networks segment designs, manufactures, sells, installs and services: (i) cellular infrastructure systems,
including hardware and software, (ii) fiber-to-the-premise (""FTTP'') and fiber-to-the-node (""FTTN'')
transmission systems supporting high-speed data, video and voice, and (iii) wireless broadband systems. In
addition, the segment designs, manufactures, and sells embedded communications computing platforms.
‚ The Connected Home Solutions segment designs, manufactures and sells a wide variety of broadband
products, including: (i) digital systems and set-top boxes for cable television, Internet Protocol (""IP'')
video and broadcast networks, (ii) high speed data products, including cable modems and cable modem
termination systems (""CMTS'') and IP-based telephony products, (iii) hybrid fiber coaxial network
transmission systems used by cable television operators, (iv) digital satellite program distribution systems,
(v) direct-to-home (""DTH'') satellite networks and private networks for business communications, and
(vi) advanced video communications products.
Segment operating results are measured based on operating earnings(loss) adjusted, if necessary, for certain
segment-specific items and corporate allocations. Intersegment and intergeographic sales are accounted for on an
arm's-length pricing basis. Intersegment sales included in adjustments and eliminations were:
Years Ended December 31
2005
2004 2003
Mobile Devices $189 $212 $209
Government and Enterprise Mobility Solutions 54 33 46
Networks 102 49 26
Connected Home Solutions 14 41
$359 $298 $282
Domestic export sales to third parties were $2.1 billion, $2.7 billion and $1.9 billion for the years ended
December 31, 2005, 2004 and 2003, respectively. Domestic export sales to affiliates and subsidiaries, which are
eliminated in consolidation, were $2.6 billion, $1.8 billion, and $1.8 billion for the years ended December 31, 2005,
2004 and 2003, respectively.
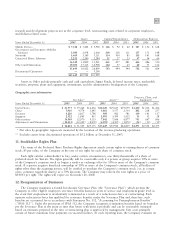
Identifiable assets (excluding intersegment receivables) are the Company's assets that are identified with classes
of similar products or operations in each geographic region.
For the years ended December 31, 2005, 2004 and 2003, approximately 12%, 13% and 12%, respectively, of
net sales were to Sprint Nextel (including Nextel and Nextel affiliates).
Segment information
Operating Earnings
Net Sales (Loss)
Years Ended December 31
2005
2004 2003
2005
2004 2003
Mobile Devices $21,455 $17,108 $11,238 $2,198 $1,728 $ 511
Government and Enterprise Mobility Solutions 6,597 6,228 5,568 882 842 663
Networks 6,332 6,026 4,846 990 718 148
Connected Home Solutions 2,765 2,214 1,745 185 146 48
37,149 31,576 23,397 4,255 3,434 1,370
Other and Eliminations (306) (253) (242) 441 (302) (97)
$36,843 $31,323 $23,155
Operating earnings 4,696 3,132 1,273
Total other income 1,824 120 103
Earnings from continuing operations before
income taxes $6,520 $3,252 $1,376
The 2005 Operating Earnings in Other as presented in Other and Eliminations above consists primarily of
collections related to Telsim, partially offset by general corporate expenses which are not identifiable with a
particular segments activity. These expenses primarily consist of costs related to developmental business and