Microsoft 2015 Annual Report Download - page 83
Download and view the complete annual report
Please find page 83 of the 2015 Microsoft annual report below. You can navigate through the pages in the report by either clicking on the pages listed below, or by using the keyword search tool below to find specific information within the annual report.-
 1
1 -
2
-
3
-
4
-
5
-
6
-
7
-
8
-
9
-
10
-
11
-
12
-
13
-
14
-
15
-
16
-
17
-
18
-
19
-
20
-
21
-
22
-
23
-
24
-
25
-
26
-
27
-
28
-
29
-
30
-
31
-
32
-
33
-
34
-
35
-
36
-
37
-
38
-
39
-
40
-
41
-
42
-
43
-
44
-
45
-
46
-
47
-
48
-
49
-
50
-
51
-
52
-
53
-
54
-
55
-
56
-
57
-
58
-
59
-
60
-
61
-
62
-
63
-
64
-
65
-
66
-
67
-
68
-
69
-
70
-
71
-
72
-
 73
73 -
 74
74 -
 75
75 -
 76
76 -
 77
77 -
 78
78 -
 79
79 -
 80
80 -
 81
81 -
 82
82 -
 83
83 -
 84
84 -
 85
85 -
 86
86 -
 87
87 -
 88
88 -
 89
89
 |
 |

82
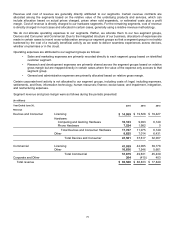
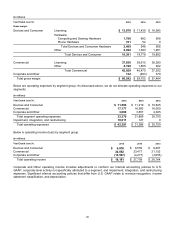
Our total Commercial Cloud revenue was $5.8 billion, $2.8 billion, and $1.3 billion in fiscal years 2015, 2014, and
2013, respectively. These amounts are included in their respective product categories in the table above.
Assets are not allocated to segments for internal reporting presentations. A portion of amortization and depreciation
is charged to the respective segment. It is impracticable for us to separately identify the amount of amortization and
depreciation by segment that is included in the measure of segment profit or loss.
Long-lived assets, excluding financial instruments and tax assets, classified by the location of the controlling statutory
company and with countries over 10% of the total shown separately, were as follows:
(In millions)
June 30, 2015
2014 2013
United States $19,562 $ 17,653 $16,615
Luxembourg 6,879 6,913 6,943
Finland 1,757 9,840 12
Other countries 8,307 5,713 4,159
Total $36,505 $ 40,119 $27,729
NOTE 23 — QUARTERLY INFORMATION (UNAUDITED)
(In millions, except per share amounts)
Quarter Ended September 30 December 31 March 31 June 30 Total
Fiscal Year 2015
Revenue $ 23,201 $ 26,470 $ 21,729 $ 22,180 $ 93,580
Gross margin 14,928 16,334 14,568 14,712 60,542
Net income (loss) 4,540 5,863 4,985 (3,195
) (a) 12,193 (b)
Basic earnings (loss) per share 0.55 0.71 0.61 (0.40 ) 1.49
Diluted earnings (loss) per share 0.54 0.71 0.61 (0.40
) (a) 1.48 (b)
Fiscal Year 2014
Revenue $ 18,529 $ 24,519 $ 20,403 $ 23,382 $ 86,833
Gross margin 13,384 16,197 14,425 15,749 59,755
Net income 5,244 6,558 5,660 4,612
(c) 22,074 (c)
Basic earnings per share 0.63 0.79 0.68 0.56 2.66
Diluted earnings per share 0.62 0.78 0.68 0.55
(c) 2.63 (c)
(a) Includes $7.5 billion of goodwill and asset impairment charges related to Phone Hardware, as well as $940
million of integration and restructuring expenses, primarily costs associated with our Phone Hardware
Restructuring Plan, which decreased fourth quarter fiscal year 2015 net income by $8.4 billion and diluted EPS
by $1.02.
(b) Includes $7.5 billion of goodwill and asset impairment charges related to Phone Hardware, as well as $2.5
billion of integration and restructuring expenses, primarily costs associated with our restructuring plans, which
decreased fiscal year 2015 net income by $10.0 billion and diluted EPS by $1.15.
(c) Includes a tax provision adjustment recorded in the fourth quarter of fiscal year 2014 related to adjustments to
prior years’ liabilities for intercompany transfer pricing which decreased net income by $458 million and diluted
EPS by $0.05.