Microsoft 2015 Annual Report Download - page 32
Download and view the complete annual report
Please find page 32 of the 2015 Microsoft annual report below. You can navigate through the pages in the report by either clicking on the pages listed below, or by using the keyword search tool below to find specific information within the annual report.-
 1
1 -
2
-
3
-
4
-
5
-
6
-
7
-
8
-
9
-
10
-
11
-
12
-
13
-
14
-
15
-
16
-
17
-
18
-
19
-
20
-
21
-
 22
22 -
 23
23 -
 24
24 -
 25
25 -
 26
26 -
 27
27 -
 28
28 -
 29
29 -
 30
30 -
 31
31 -
 32
32 -
 33
33 -
 34
34 -
 35
35 -
 36
36 -
 37
37 -
 38
38 -
 39
39 -
 40
40 -
 41
41 -
 42
42 -
43
-
44
-
45
-
46
-
47
-
48
-
49
-
50
-
51
-
52
-
53
-
54
-
55
-
56
-
57
-
58
-
59
-
60
-
61
-
62
-
63
-
64
-
65
-
66
-
67
-
68
-
69
-
70
-
71
-
72
-
73
-
74
-
75
-
76
-
77
-
78
-
79
-
80
-
81
-
82
-
83
-
84
-
85
-
86
-
87
-
88
-
89
 |
 |

31
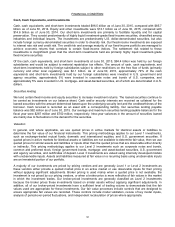
INCOME TAXES
Fiscal year 2015 compared with fiscal year 2014
Our effective tax rate for fiscal years 2015 and 2014 was approximately 34% and 21%, respectively. The fiscal year
2015 effective rate increased by 13%, primarily due to goodwill and asset impairments and restructuring charges
recorded in fiscal year 2015, most of which did not generate a tax benefit. Our effective tax rate was lower than the
U.S. federal statutory rate primarily due to foreign earnings taxed at lower rates resulting from producing and
distributing our products and services through our foreign regional operations centers in Ireland, Singapore, and
Puerto Rico. In fiscal year 2015, this reduction was mostly offset by losses in foreign jurisdictions for which we may
not realize a tax benefit, primarily as a result of impairment and restructuring charges.
Changes in the mix of income before income taxes between the U.S. and foreign countries also impacted our
effective tax rates and resulted primarily from changes in the geographic distribution of and changes in consumer
demand for our products and services. We supply our Windows PC operating system to customers through our U.S.
regional operating center, while we supply the Microsoft Office system and our server products and tools to
customers through our foreign regional operations centers. In fiscal years 2015 and 2014, our U.S. income before
income taxes was $7.4 billion and $7.1 billion, respectively, and comprised 40% and 26%, respectively, of our
income before income taxes. In fiscal years 2015 and 2014, our foreign income before income taxes was $11.1
billion and $20.7 billion, respectively, and comprised 60% and 74%, respectively, of our income before income taxes.
Tax contingencies and other income tax liabilities were $12.1 billion and $10.4 billion as of June 30, 2015 and 2014,
respectively, and are included in other long-term liabilities. This increase relates primarily to adjustments to prior
years’ liabilities for intercompany transfer pricing and adjustments related to our IRS audits. While we settled a
portion of the I.R.S. audit for tax years 2004 to 2006 during the third quarter of fiscal year 2011, we remain under
audit for those years. In February 2012, the I.R.S. withdrew its 2011 Revenue Agents Report and reopened the audit
phase of the examination. As of June 30, 2015, the primary unresolved issue relates to transfer pricing, which could
have a significant impact on our consolidated financial statements if not resolved favorably. We believe our
allowances for income tax contingencies are adequate. We have not received a proposed assessment for the
unresolved issues and do not expect a final resolution of these issues in the next 12 months. Based on the
information currently available, we do not anticipate a significant increase or decrease to our tax contingencies for
these issues within the next 12 months. We also continue to be subject to examination by the I.R.S. for tax years
2007 to 2015.
We are subject to income tax in many jurisdictions outside the U.S. Our operations in certain jurisdictions remain
subject to examination for tax years 1996 to 2015, some of which are currently under audit by local tax authorities.
The resolutions of these audits are not expected to be material to our consolidated financial statements.
Fiscal year 2014 compared with fiscal year 2013
Our effective tax rate for fiscal years 2014 and 2013 was approximately 21% and 19%, respectively. Our effective tax
rate was lower than the U.S. federal statutory rate primarily due to earnings taxed at lower rates in foreign
jurisdictions resulting from producing and distributing our products and services through our foreign regional
operations centers in Ireland, Singapore, and Puerto Rico.
Our fiscal year 2014 effective rate increased by 2% from fiscal year 2013 mainly due to adjustments of $458 million
to prior years’ liabilities for intercompany transfer pricing that increased taxable income in more highly taxed
jurisdictions, as well as losses incurred by NDS and changes in the geographic mix of our business. This was offset
in part by favorable transfer pricing developments in certain foreign tax jurisdictions, primarily Denmark.
Changes in the mix of income before income taxes between the U.S. and foreign countries also impacted our
effective tax rates and resulted primarily from changes in the geographic distribution of and changes in consumer
demand for our products and services. We supply our Windows PC operating system to customers through our U.S.
regional operating center, while we supply the Microsoft Office system and our server products and tools to
customers through our foreign regional operations centers. Windows PC operating system revenue decreased $655
million in fiscal year 2014, while Microsoft Office system and server products and tools revenue increased $1.3 billion
and $1.6 billion, respectively, during this same period. In fiscal years 2014 and 2013, our U.S. income before income
taxes was $7.1 billion and $6.7 billion, respectively, and comprised 26% and 25%, respectively, of our income before
income taxes. In fiscal years 2014 and 2013, the foreign income before income taxes was $20.7 billion and $20.4
billion, respectively, and comprised 74% and 75%, respectively, of our income before income taxes.