Microsoft 2015 Annual Report Download - page 42
Download and view the complete annual report
Please find page 42 of the 2015 Microsoft annual report below. You can navigate through the pages in the report by either clicking on the pages listed below, or by using the keyword search tool below to find specific information within the annual report.-
 1
1 -
2
-
3
-
4
-
5
-
6
-
7
-
8
-
9
-
10
-
11
-
12
-
13
-
14
-
15
-
16
-
17
-
18
-
19
-
20
-
21
-
22
-
23
-
24
-
25
-
26
-
27
-
28
-
29
-
30
-
31
-
 32
32 -
 33
33 -
 34
34 -
 35
35 -
 36
36 -
 37
37 -
 38
38 -
 39
39 -
 40
40 -
 41
41 -
 42
42 -
 43
43 -
 44
44 -
 45
45 -
 46
46 -
 47
47 -
 48
48 -
 49
49 -
 50
50 -
 51
51 -
 52
52 -
53
-
54
-
55
-
56
-
57
-
58
-
59
-
60
-
61
-
62
-
63
-
64
-
65
-
66
-
67
-
68
-
69
-
70
-
71
-
72
-
73
-
74
-
75
-
76
-
77
-
78
-
79
-
80
-
81
-
82
-
83
-
84
-
85
-
86
-
87
-
88
-
89
 |
 |

41
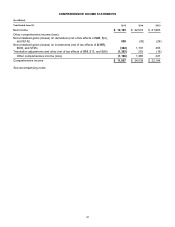
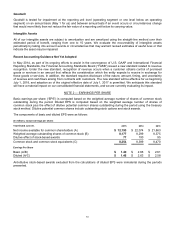
FINANCIAL STATEMENTS AND SUPPLEMENTARY DATA
INCOME STATEMENTS
(In millions, except per share amounts)
Y
ear Ended June 30, 2015
2014 2013
Revenue $ 93,580 $ 86,833 $ 77,849
Cost of revenue 33,038 27,078 20,385
Gross margin 60,542 59,755 57,464
Research and development 12,046 11,381 10,411
Sales and marketing 15,713 15,811 15,276
General and administrative 4,611 4,677 5,013
Impairment, integration, and restructuring 10,011 127 0
Operating income 18,161 27,759 26,764
Other income, net 346 61 288
Income before income taxes 18,507 27,820 27,052
Provision for income taxes 6,314 5,746 5,189
Net income $12,193 $ 22,074 $21,863
Earnings per share:
Basic $1.49 $ 2.66 $2.61
Diluted $1.48 $ 2.63 $2.58
Weighted average shares outstanding:
Basic 8,177 8,299 8,375
Diluted 8,254 8,399 8,470
Cash dividends declared per common share $1.24 $ 1.12 $0.92
See accompanying notes.