Microsoft 2015 Annual Report Download - page 53
Download and view the complete annual report
Please find page 53 of the 2015 Microsoft annual report below. You can navigate through the pages in the report by either clicking on the pages listed below, or by using the keyword search tool below to find specific information within the annual report.-
 1
1 -
2
-
3
-
4
-
5
-
6
-
7
-
8
-
9
-
10
-
11
-
12
-
13
-
14
-
15
-
16
-
17
-
18
-
19
-
20
-
21
-
22
-
23
-
24
-
25
-
26
-
27
-
28
-
29
-
30
-
31
-
32
-
33
-
34
-
35
-
36
-
37
-
38
-
39
-
40
-
41
-
42
-
 43
43 -
 44
44 -
 45
45 -
 46
46 -
 47
47 -
 48
48 -
 49
49 -
 50
50 -
 51
51 -
 52
52 -
 53
53 -
 54
54 -
 55
55 -
 56
56 -
 57
57 -
 58
58 -
 59
59 -
 60
60 -
 61
61 -
 62
62 -
 63
63 -
64
-
65
-
66
-
67
-
68
-
69
-
70
-
71
-
72
-
73
-
74
-
75
-
76
-
77
-
78
-
79
-
80
-
81
-
82
-
83
-
84
-
85
-
86
-
87
-
88
-
89
 |
 |

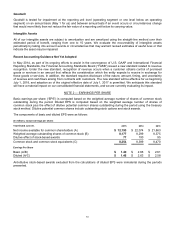
52
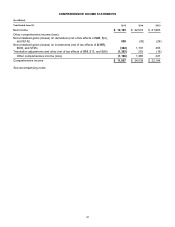
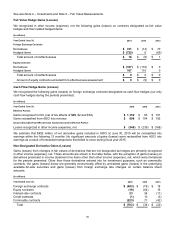
NOTE 3 — OTHER INCOME (EXPENSE), NET
The components of other income (expense), net were as follows:
(In millions)
Y
ear Ended June 30, 2015
2014 2013
Dividends and interest income $ 766 $ 883 $ 677
Interest expense (781 ) (597) (429)
Net recognized gains on investments 716 437 116
Net losses on derivatives (423 ) (328) (196)
Net gains (losses) on foreign currency remeasurements 335 (165) (74)
Other (267 ) (169) 194
Total $ 346 $ 61 $288
Following are details of net recognized gains on investments during the periods reported:
(In millions)
Y
ear Ended June 30, 2015
2014 2013
Other-than-temporary impairments of investments $(183 ) $ (106) $(208)
Realized gains from sales of available-for-sale securities 1,176 776 489
Realized losses from sales of available-for-sale securities (277 ) (233) (165)
Total $716 $ 437 $116
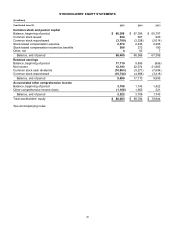
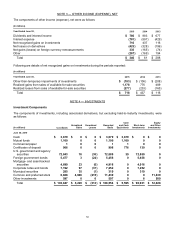
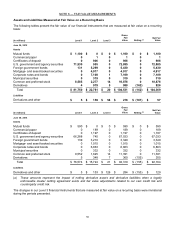
NOTE 4 — INVESTMENTS
Investment Components
The components of investments, including associated derivatives, but excluding held-to-maturity investments, were
as follows:
(In millions) Cost Basis
Unrealized
Gains
Unrealized
Losses
Recorded
Basis
Cash
and Cash
Equivalents
Short-term
Investments
Equity
and Other
Investments
June 30, 2015
Cash $ 3,679 $ 0 $ 0 $ 3,679 $ 3,679 $ 0 $ 0
Mutual funds 1,100 0 0 1,100 1,100 0 0
Commercial paper 1 0 0 1 1 0 0
Certificates of deposit 906 0 0 906 776 130 0
U.S. government and agency
securities 72,843 76 (30) 72,889 39 72,850 0
Foreign government bonds 5,477 3 (24) 5,456 0 5,456 0
Mortgage- and asset-backed
securities 4,899 23 (6) 4,916 0 4,916 0
Corporate notes and bonds 7,192 97 (37) 7,252 0 7,252 0
Municipal securities 285 35 (1) 319 0 319 0
Common and preferred stock 6,668 4,986 (215) 11,439 0 0 11,439
Other investments 597 0 0 597 0 8 589
Total $ 103,647 $ 5,220 $ (313) $ 108,554 $ 5,595 $ 90,931 $ 12,028