Microsoft 2015 Annual Report Download - page 49
Download and view the complete annual report
Please find page 49 of the 2015 Microsoft annual report below. You can navigate through the pages in the report by either clicking on the pages listed below, or by using the keyword search tool below to find specific information within the annual report.-
 1
1 -
2
-
3
-
4
-
5
-
6
-
7
-
8
-
9
-
10
-
11
-
12
-
13
-
14
-
15
-
16
-
17
-
18
-
19
-
20
-
21
-
22
-
23
-
24
-
25
-
26
-
27
-
28
-
29
-
30
-
31
-
32
-
33
-
34
-
35
-
36
-
37
-
38
-
 39
39 -
 40
40 -
 41
41 -
 42
42 -
 43
43 -
 44
44 -
 45
45 -
 46
46 -
 47
47 -
 48
48 -
 49
49 -
 50
50 -
 51
51 -
 52
52 -
 53
53 -
 54
54 -
 55
55 -
 56
56 -
 57
57 -
 58
58 -
 59
59 -
60
-
61
-
62
-
63
-
64
-
65
-
66
-
67
-
68
-
69
-
70
-
71
-
72
-
73
-
74
-
75
-
76
-
77
-
78
-
79
-
80
-
81
-
82
-
83
-
84
-
85
-
86
-
87
-
88
-
89
 |
 |
48
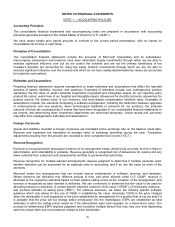
Product Warranty
We provide for the estimated costs of fulfilling our obligations under hardware and software warranties at the time the
related revenue is recognized. For hardware warranties, we estimate the costs based on historical and projected
product failure rates, historical and projected repair costs, and knowledge of specific product failures (if any). The
specific hardware warranty terms and conditions vary depending upon the product sold and the country in which we
do business, but generally include parts and labor over a period generally ranging from 90 days to three years. For
software warranties, we estimate the costs to provide bug fixes, such as security patches, over the estimated life of
the software. We regularly reevaluate our estimates to assess the adequacy of the recorded warranty liabilities and
adjust the amounts as necessary.
Research and Development
Research and development expenses include payroll, employee benefits, stock-based compensation expense, and
other headcount-related expenses associated with product development. Research and development expenses also
include third-party development and programming costs, localization costs incurred to translate software for
international markets, and the amortization of purchased software code and services content. Such costs related to
software development are included in research and development expense until the point that technological feasibility
is reached, which for our software products, is generally shortly before the products are released to manufacturing.
Once technological feasibility is reached, such costs are capitalized and amortized to cost of revenue over the
estimated lives of the products.
Sales and Marketing
Sales and marketing expenses include payroll, employee benefits, stock-based compensation expense, and other
headcount-related expenses associated with sales and marketing personnel, and the costs of advertising,
promotions, trade shows, seminars, and other programs. Advertising costs are expensed as incurred. Advertising
expense was $1.9 billion, $2.3 billion, and $2.6 billion in fiscal years 2015, 2014, and 2013, respectively.
Stock-Based Compensation
We measure stock-based compensation cost at the grant date based on the fair value of the award and recognize it
as expense, net of estimated forfeitures, over the vesting or service period, as applicable, of the stock award
(generally four to five years) using the straight-line method.
Employee Stock Purchase Plan
Shares of our common stock may be purchased by employees at three-month intervals at 90% of the fair market
value of the stock on the last day of each three-month period. Compensation expense for the employee stock
purchase plan is measured as the discount the employee is entitled to upon purchase and is recognized in the period
of purchase.
Income Taxes
Income tax expense includes U.S. and international income taxes, the provision for U.S. taxes on undistributed
earnings of international subsidiaries not deemed to be permanently invested, and interest and penalties on
uncertain tax positions. Certain income and expenses are not reported in tax returns and financial statements in the
same year. The tax effect of such temporary differences is reported as deferred income taxes. Deferred tax assets
are reported net of a valuation allowance when it is more likely than not that a tax benefit will not be realized. The
deferred income taxes are classified as current or long-term based on the classification of the related asset or
liability.
Fair Value Measurements
We account for certain assets and liabilities at fair value. The hierarchy below lists three levels of fair value based on
the extent to which inputs used in measuring fair value are observable in the market. We categorize each of our fair
value measurements in one of these three levels based on the lowest level input that is significant to the fair value
measurement in its entirety. These levels are:
• Level 1 – inputs are based upon unadjusted quoted prices for identical instruments traded in active
markets. Our Level 1 non-derivative investments primarily include U.S. government securities, domestic