Microsoft 2015 Annual Report Download - page 31
Download and view the complete annual report
Please find page 31 of the 2015 Microsoft annual report below. You can navigate through the pages in the report by either clicking on the pages listed below, or by using the keyword search tool below to find specific information within the annual report.-
 1
1 -
2
-
3
-
4
-
5
-
6
-
7
-
8
-
9
-
10
-
11
-
12
-
13
-
14
-
15
-
16
-
17
-
18
-
19
-
20
-
 21
21 -
 22
22 -
 23
23 -
 24
24 -
 25
25 -
 26
26 -
 27
27 -
 28
28 -
 29
29 -
 30
30 -
 31
31 -
 32
32 -
 33
33 -
 34
34 -
 35
35 -
 36
36 -
 37
37 -
 38
38 -
 39
39 -
 40
40 -
 41
41 -
42
-
43
-
44
-
45
-
46
-
47
-
48
-
49
-
50
-
51
-
52
-
53
-
54
-
55
-
56
-
57
-
58
-
59
-
60
-
61
-
62
-
63
-
64
-
65
-
66
-
67
-
68
-
69
-
70
-
71
-
72
-
73
-
74
-
75
-
76
-
77
-
78
-
79
-
80
-
81
-
82
-
83
-
84
-
85
-
86
-
87
-
88
-
89
 |
 |

30
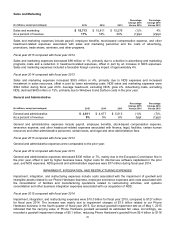
million, net of foreign currency remeasurements, as well as an impairment charge of $2.2 billion related to the write-
down of Phone Hardware intangible assets. Restructuring charges were $2.1 billion, including employee severance
expenses and the write-down of certain assets in connection with our restructuring activities. Integration expenses
increased $308 million, due to a full-year of integration activities in fiscal year 2015 associated with the acquisition of
NDS.
Fiscal year 2014 compared with fiscal year 2013
Impairment, integration, and restructuring expenses were $127 million for fiscal year 2014, reflecting integration
expenses associated with the acquisition of NDS. No impairment, integration, and restructuring expenses were
recorded in fiscal year 2013.
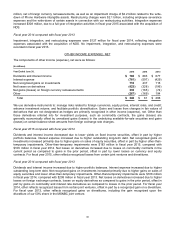
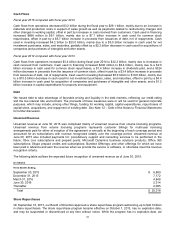
OTHER INCOME (EXPENSE), NET
The components of other income (expense), net were as follows:
(In millions)
Y
ear Ended June 30, 2015
2014 2013
Dividends and interest income $ 766 $ 883 $ 677
Interest expense (781 ) (597) (429)
Net recognized gains on investments 716 437 116
Net losses on derivatives (423 ) (328) (196)
Net gains (losses) on foreign currency remeasurements 335 (165) (74)
Other (267 ) (169) 194
Total $ 346 $ 61 $288
We use derivative instruments to: manage risks related to foreign currencies, equity prices, interest rates, and credit;
enhance investment returns; and facilitate portfolio diversification. Gains and losses from changes in fair values of
derivatives that are not designated as hedges are primarily recognized in other income (expense), net. Other than
those derivatives entered into for investment purposes, such as commodity contracts, the gains (losses) are
generally economically offset by unrealized gains (losses) in the underlying available-for-sale securities and gains
(losses) on certain balance sheet amounts from foreign exchange rate changes.
Fiscal year 2015 compared with fiscal year 2014
Dividends and interest income decreased due to lower yields on fixed income securities, offset in part by higher
portfolio balances. Interest expense increased due to higher outstanding long-term debt. Net recognized gains on
investments increased primarily due to higher gains on sales of equity securities, offset in part by higher other-than-
temporary impairments. Other-than-temporary impairments were $183 million in fiscal year 2015, compared with
$106 million in fiscal year 2014. Net losses on derivatives increased due to losses on commodity contracts in the
current period as compared to gains in the prior period, offset in part by lower losses on currency and equity
contracts. For fiscal year 2015, other reflects recognized losses from certain joint ventures and divestitures.
Fiscal year 2014 compared with fiscal year 2013
Dividends and interest income increased due to higher portfolio balances. Interest expense increased due to higher
outstanding long-term debt. Net recognized gains on investments increased primarily due to higher gains on sales of
equity securities and lower other-than-temporary impairments. Other-than-temporary impairments were $106 million
in fiscal year 2014, compared with $208 million in fiscal year 2013. Net losses on derivatives increased due to higher
losses on foreign exchange contracts, losses on equity derivatives as compared to gains in the prior period, offset in
part by gains on commodity and interest rate derivatives as compared to losses in the prior period. For fiscal year
2014, other reflects recognized losses from certain joint ventures, offset in part by a recognized gain on a divestiture.
For fiscal year 2013, other reflects recognized gains on divestitures, including the gain recognized upon the
divestiture of our 50% share in the MSNBC joint venture.