Microsoft 2015 Annual Report Download - page 30
Download and view the complete annual report
Please find page 30 of the 2015 Microsoft annual report below. You can navigate through the pages in the report by either clicking on the pages listed below, or by using the keyword search tool below to find specific information within the annual report.-
 1
1 -
2
-
3
-
4
-
5
-
6
-
7
-
8
-
9
-
10
-
11
-
12
-
13
-
14
-
15
-
16
-
17
-
18
-
19
-
 20
20 -
 21
21 -
 22
22 -
 23
23 -
 24
24 -
 25
25 -
 26
26 -
 27
27 -
 28
28 -
 29
29 -
 30
30 -
 31
31 -
 32
32 -
 33
33 -
 34
34 -
 35
35 -
 36
36 -
 37
37 -
 38
38 -
 39
39 -
 40
40 -
41
-
42
-
43
-
44
-
45
-
46
-
47
-
48
-
49
-
50
-
51
-
52
-
53
-
54
-
55
-
56
-
57
-
58
-
59
-
60
-
61
-
62
-
63
-
64
-
65
-
66
-
67
-
68
-
69
-
70
-
71
-
72
-
73
-
74
-
75
-
76
-
77
-
78
-
79
-
80
-
81
-
82
-
83
-
84
-
85
-
86
-
87
-
88
-
89
 |
 |

29
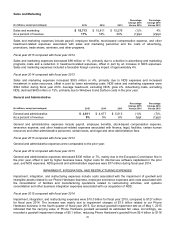
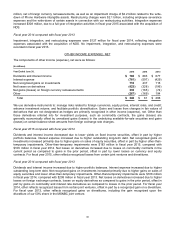
Sales and Marketing
(In millions, except percentages) 2015 2014 2013
Percentage
Change 2015
Versus 2014
Percentage
Change 2014
Versus 2013
Sales and marketing $ 15,713 $ 15,811 $ 15,276 (1)% 4%
As a percent of revenue 17% 18% 20% (1)ppt (2)ppt
Sales and marketing expenses include payroll, employee benefits, stock-based compensation expense, and other
headcount-related expenses associated with sales and marketing personnel and the costs of advertising,
promotions, trade shows, seminars, and other programs.
Fiscal year 2015 compared with fiscal year 2014
Sales and marketing expenses decreased $98 million or 1%, primarily due to a decline in advertising and marketing
programs costs and a reduction in headcount-related expenses, offset in part by an increase in NDS expenses.
Sales and marketing expenses included a favorable foreign currency impact of approximately 4%.
Fiscal year 2014 compared with fiscal year 2013
Sales and marketing expenses increased $535 million or 4%, primarily due to NDS expenses and increased
investment in sales resources, offset in part by lower advertising costs. NDS sales and marketing expenses were
$394 million during fiscal year 2014. Average headcount, excluding NDS, grew 4%. Advertising costs, excluding
NDS, declined $403 million or 15%, primarily due to Windows 8 and Surface costs in the prior year.
General and Administrative
(In millions, except percentages) 2015 2014 2013
Percentage
Change 2015
Versus 2014
Percentage
Change 2014
Versus 2013
General and administrative $ 4,611 $ 4,677 $ 5,013 (1)% (7)%
As a percent of revenue 5% 5% 6% 0ppt (1)ppt
General and administrative expenses include payroll, employee benefits, stock-based compensation expense,
severance expense, and other headcount-related expenses associated with finance, legal, facilities, certain human
resources and other administrative personnel, certain taxes, and legal and other administrative fees.
Fiscal year 2015 compared with fiscal year 2014
General and administrative expenses were comparable to the prior year.
Fiscal year 2014 compared with fiscal year 2013
General and administrative expenses decreased $336 million or 7%, mainly due to the European Commission fine in
the prior year, offset in part by higher business taxes, higher costs for internal use software capitalized in the prior
year, and NDS expenses. NDS general and administrative expenses were $77 million during fiscal year 2014.
IMPAIRMENT, INTEGRATION, AND RESTRUCTURING EXPENSES
Impairment, integration, and restructuring expenses include costs associated with the impairment of goodwill and
intangible assets related to our Phone Hardware business, employee severance expenses and costs associated with
the consolidation of facilities and manufacturing operations related to restructuring activities, and systems
consolidation and other business integration expenses associated with our acquisition of NDS.
Fiscal year 2015 compared with fiscal year 2014
Impairment, integration, and restructuring expenses were $10.0 billion for fiscal year 2015, compared to $127 million
for fiscal year 2014. The increase was mainly due to impairment charges of $7.5 billion related to our Phone
Hardware business in the fourth quarter of fiscal year 2015. Our annual goodwill impairment test as of May 1, 2015
indicated that the carrying value of Phone Hardware goodwill exceeded its estimated fair value. Accordingly, we
recorded a goodwill impairment charge of $5.1 billion, reducing Phone Hardware’s goodwill from $5.4 billion to $116