Microsoft 2015 Annual Report Download - page 66
Download and view the complete annual report
Please find page 66 of the 2015 Microsoft annual report below. You can navigate through the pages in the report by either clicking on the pages listed below, or by using the keyword search tool below to find specific information within the annual report.-
 1
1 -
2
-
3
-
4
-
5
-
6
-
7
-
8
-
9
-
10
-
11
-
12
-
13
-
14
-
15
-
16
-
17
-
18
-
19
-
20
-
21
-
22
-
23
-
24
-
25
-
26
-
27
-
28
-
29
-
30
-
31
-
32
-
33
-
34
-
35
-
36
-
37
-
38
-
39
-
40
-
41
-
42
-
43
-
44
-
45
-
46
-
47
-
48
-
49
-
50
-
51
-
52
-
53
-
54
-
55
-
 56
56 -
 57
57 -
 58
58 -
 59
59 -
 60
60 -
 61
61 -
 62
62 -
 63
63 -
 64
64 -
 65
65 -
 66
66 -
 67
67 -
 68
68 -
 69
69 -
 70
70 -
 71
71 -
 72
72 -
 73
73 -
 74
74 -
 75
75 -
 76
76 -
77
-
78
-
79
-
80
-
81
-
82
-
83
-
84
-
85
-
86
-
87
-
88
-
89
 |
 |

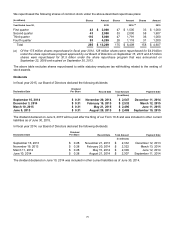
65
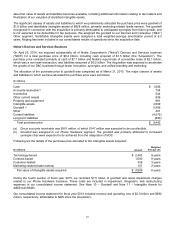
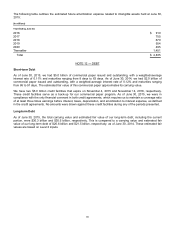
The following table outlines the estimated future amortization expense related to intangible assets held at June 30,
2015:
(In millions)
Y
ear Ending June 30,
2016 $910
2017 755
2018 670
2019 554
2020 495
Thereafter 1,451
Total $ 4,835
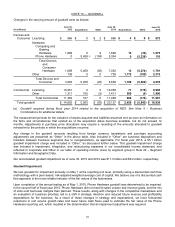
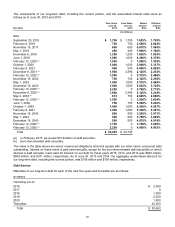
NOTE 12 — DEBT
Short-term Debt
As of June 30, 2015, we had $5.0 billion of commercial paper issued and outstanding, with a weighted-average
interest rate of 0.11% and maturities ranging from 8 days to 63 days. As of June 30, 2014, we had $2.0 billion of
commercial paper issued and outstanding, with a weighted-average interest rate of 0.12% and maturities ranging
from 86 to 91 days. The estimated fair value of this commercial paper approximates its carrying value.
We have two $5.0 billion credit facilities that expire on November 4, 2015 and November 14, 2018, respectively.
These credit facilities serve as a back-up for our commercial paper program. As of June 30, 2015, we were in
compliance with the only financial covenant in both credit agreements, which requires us to maintain a coverage ratio
of at least three times earnings before interest, taxes, depreciation, and amortization to interest expense, as defined
in the credit agreements. No amounts were drawn against these credit facilities during any of the periods presented.
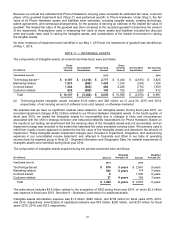
Long-term Debt
As of June 30, 2015, the total carrying value and estimated fair value of our long-term debt, including the current
portion, were $30.3 billion and $30.5 billion, respectively. This is compared to a carrying value and estimated fair
value of our long-term debt of $20.6 billion and $21.5 billion, respectively, as of June 30, 2014. These estimated fair
values are based on Level 2 inputs.