Microsoft 2015 Annual Report Download - page 60
Download and view the complete annual report
Please find page 60 of the 2015 Microsoft annual report below. You can navigate through the pages in the report by either clicking on the pages listed below, or by using the keyword search tool below to find specific information within the annual report.-
 1
1 -
2
-
3
-
4
-
5
-
6
-
7
-
8
-
9
-
10
-
11
-
12
-
13
-
14
-
15
-
16
-
17
-
18
-
19
-
20
-
21
-
22
-
23
-
24
-
25
-
26
-
27
-
28
-
29
-
30
-
31
-
32
-
33
-
34
-
35
-
36
-
37
-
38
-
39
-
40
-
41
-
42
-
43
-
44
-
45
-
46
-
47
-
48
-
49
-
 50
50 -
 51
51 -
 52
52 -
 53
53 -
 54
54 -
 55
55 -
 56
56 -
 57
57 -
 58
58 -
 59
59 -
 60
60 -
 61
61 -
 62
62 -
 63
63 -
 64
64 -
 65
65 -
 66
66 -
 67
67 -
 68
68 -
 69
69 -
 70
70 -
71
-
72
-
73
-
74
-
75
-
76
-
77
-
78
-
79
-
80
-
81
-
82
-
83
-
84
-
85
-
86
-
87
-
88
-
89
 |
 |

59
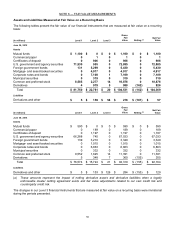
NOTE 6 — FAIR VALUE MEASUREMENTS
Assets and Liabilities Measured at Fair Value on a Recurring Basis
The following tables present the fair value of our financial instruments that are measured at fair value on a recurring
basis:
(In millions) Level 1 Level 2 Level 3
Gross
Fair
Value
Netting (a)
Net Fair
Value
June 30, 2015
Assets
Mutual funds $1,100 $ 0 $ 0 $ 1,100 $ 0 $1,100
Commercial paper 0 1 0 1 0 1
Certificates of deposit 0 906 0 906 0 906
U.S. government and agency securities 71,930 955 0 72,885 0 72,885
Foreign government bonds 131 5,299 0 5,430 0 5,430
Mortgage- and asset-backed securities 0 4,917 0 4,917 0 4,917
Corporate notes and bonds 0 7,108 1 7,109 0 7,109
Municipal securities 0 319 0 319 0 319
Common and preferred stock 8,585 2,277 14 10,876 0 10,876
Derivatives 4 979 5 988 (162) 826
Total $81,750 $ 22,761 $ 20 $ 104,531 $ (162) $ 104,369
Liabilities
Derivatives and other $ 5 $ 159 $ 54 $ 218 $ (161) $57
(In millions) Level 1 Level 2 Level 3
Gross
Fair
Value
Netting (a)
Net Fair
Value
June 30, 2014
Assets
Mutual funds $590 $0 $0 $590 $ 0 $590
Commercial paper 0 189 0 189 0 189
Certificates of deposit 0 1,197 0 1,197 0 1,197
U.S. government and agency securities 66,288 745 0 67,033 0 67,033
Foreign government bonds 139 3,210 0 3,349 0 3,349
Mortgage- and asset-backed securities 0 1,015 0 1,015 0 1,015
Corporate notes and bonds 0 6,863 0 6,863 0 6,863
Municipal securities 0 332 0 332 0 332
Common and preferred stock 9,552 1,825 14 11,391 0 11,391
Derivatives 5 348 7 360 (155) 205
Total $ 76,574 $ 15,724 $21 $92,319 $ (155) $92,164
Liabilities
Derivatives and other $5 $153 $ 126 $284 $ (155) $129
(a) These amounts represent the impact of netting derivative assets and derivative liabilities when a legally
enforceable master netting agreement exists and fair value adjustments related to our own credit risk and
counterparty credit risk.
The changes in our Level 3 financial instruments that are measured at fair value on a recurring basis were immaterial
during the periods presented.