Microsoft 2015 Annual Report Download - page 82
Download and view the complete annual report
Please find page 82 of the 2015 Microsoft annual report below. You can navigate through the pages in the report by either clicking on the pages listed below, or by using the keyword search tool below to find specific information within the annual report.-
 1
1 -
2
-
3
-
4
-
5
-
6
-
7
-
8
-
9
-
10
-
11
-
12
-
13
-
14
-
15
-
16
-
17
-
18
-
19
-
20
-
21
-
22
-
23
-
24
-
25
-
26
-
27
-
28
-
29
-
30
-
31
-
32
-
33
-
34
-
35
-
36
-
37
-
38
-
39
-
40
-
41
-
42
-
43
-
44
-
45
-
46
-
47
-
48
-
49
-
50
-
51
-
52
-
53
-
54
-
55
-
56
-
57
-
58
-
59
-
60
-
61
-
62
-
63
-
64
-
65
-
66
-
67
-
68
-
69
-
70
-
71
-
 72
72 -
 73
73 -
 74
74 -
 75
75 -
 76
76 -
 77
77 -
 78
78 -
 79
79 -
 80
80 -
 81
81 -
 82
82 -
 83
83 -
 84
84 -
 85
85 -
 86
86 -
 87
87 -
 88
88 -
 89
89
 |
 |

81
Corporate and Other activity was as follows:
(In millions)
Y
ear Ended June 30, 2015
2014 2013
Corporate (a) (b) $ (13,575 ) $ (3,744) $ (4,102)
Other (adjustments to U.S. GAAP):
Revenue reconciling amounts (c) 204 (415) 403
Cost of revenue reconciling amounts (72 ) (78) (31)
Operating expenses reconciling amounts (124 ) (40) 75
Total Corporate and Other $(13,567 ) $ (4,277) $(3,655)
(a) Corporate is presented on the basis of our internal accounting policies and excludes the adjustments to U.S.
GAAP that are presented separately in those line items.
(b) Corporate for fiscal year 2015 included impairment, integration, and restructuring expenses of $10.0 billion.
(c) Revenue reconciling amounts for fiscal year 2015 included a net $303 million of previously deferred net
revenue related to sales of bundled products and services (“Bundled Offerings”). Revenue reconciling amounts
for fiscal year 2014 included a net $349 million of revenue deferrals related to Bundled Offerings. Revenue
reconciling amounts for fiscal year 2013 included the recognition of $540 million of revenue previously deferred
on sales of Windows 7 with an option to upgrade to Windows 8 Pro at a discounted price.
No sales to an individual customer or country other than the United States accounted for more than 10% of fiscal
year 2015, 2014, or 2013 revenue. Revenue, classified by the major geographic areas in which our customers are
located, was as follows:
(In millions)
Y
ear Ended June 30, 2015
2014 2013
United States (a) $ 42,941 $ 43,474 $ 41,344
Other countries 50,639 43,359 36,505
Total $93,580 $ 86,833 $77,849
(a) Includes billings to OEMs and certain multinational organizations because of the nature of these businesses
and the impracticability of determining the geographic source of the revenue.
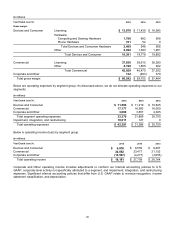
Revenue from external customers, classified by significant product and service offerings were as follows:
(In millions)
Y
ear Ended June 30, 2015
2014 2013
Microsoft Office system $ 23,538 $ 24,323 $ 22,995
Server products and tools 18,612
17,055 15,408
Windows PC operating system 14,826 16,856 17,529
Xbox 9,121 8,643 7,100
Phone 7,702 3,073 615
Consulting and product support services 5,090 4,767 4,372
Advertising 4,557 4,016 3,387
Surface 3,900 1,883 853
Other 6,234 6,217 5,590
Total $93,580 $ 86,833 $77,849