Microsoft 2015 Annual Report Download - page 29
Download and view the complete annual report
Please find page 29 of the 2015 Microsoft annual report below. You can navigate through the pages in the report by either clicking on the pages listed below, or by using the keyword search tool below to find specific information within the annual report.-
 1
1 -
2
-
3
-
4
-
5
-
6
-
7
-
8
-
9
-
10
-
11
-
12
-
13
-
14
-
15
-
16
-
17
-
18
-
 19
19 -
 20
20 -
 21
21 -
 22
22 -
 23
23 -
 24
24 -
 25
25 -
 26
26 -
 27
27 -
 28
28 -
 29
29 -
 30
30 -
 31
31 -
 32
32 -
 33
33 -
 34
34 -
 35
35 -
 36
36 -
 37
37 -
 38
38 -
 39
39 -
40
-
41
-
42
-
43
-
44
-
45
-
46
-
47
-
48
-
49
-
50
-
51
-
52
-
53
-
54
-
55
-
56
-
57
-
58
-
59
-
60
-
61
-
62
-
63
-
64
-
65
-
66
-
67
-
68
-
69
-
70
-
71
-
72
-
73
-
74
-
75
-
76
-
77
-
78
-
79
-
80
-
81
-
82
-
83
-
84
-
85
-
86
-
87
-
88
-
89
 |
 |

28
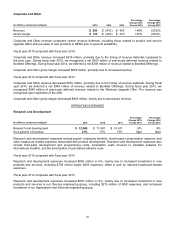
Corporate and Other
(In millions, except percentages) 2015 2014 2013
Percentage
Change 2015
Versus 2014
Percentage
Change 2014
Versus 2013
Revenue $ 204 $ (415) $ 403 149% (203)%
Gross margin $132 $(493) $370 127% (233)%
Corporate and Other revenue comprises certain revenue deferrals, including those related to product and service
upgrade offers and pre-sales of new products to OEMs prior to general availability.
Fiscal year 2015 compared with fiscal year 2014
Corporate and Other revenue increased $619 million, primarily due to the timing of revenue deferrals compared to
the prior year. During fiscal year 2015, we recognized a net $303 million of previously deferred revenue related to
Bundled Offerings. During fiscal year 2014, we deferred a net $349 million of revenue related to Bundled Offerings.
Corporate and Other gross margin increased $625 million, primarily due to increased revenue.
Fiscal year 2014 compared with fiscal year 2013
Corporate and Other revenue decreased $818 million, primarily due to the timing of revenue deferrals. During fiscal
year 2014, we deferred a net $349 million of revenue related to Bundled Offerings. During fiscal year 2013, we
recognized $540 million of previously deferred revenue related to the Windows Upgrade Offer. The revenue was
recognized upon expiration of the offer.
Corporate and Other gross margin decreased $863 million, mainly due to decreased revenue.
OPERATING EXPENSES
Research and Development
(In millions, except percentages) 2015 2014 2013
Percentage
Change 2015
Versus 2014
Percentage
Change 2014
Versus 2013
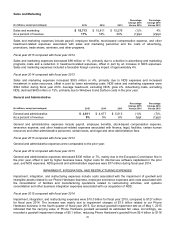
Research and development $ 12,046 $ 11,381 $ 10,411 6% 9%
As a percent of revenue 13% 13% 13% 0ppt 0ppt
Research and development expenses include payroll, employee benefits, stock-based compensation expense, and
other headcount-related expenses associated with product development. Research and development expenses also
include third-party development and programming costs, localization costs incurred to translate software for
international markets, and the amortization of purchased software code.
Fiscal year 2015 compared with fiscal year 2014
Research and development expenses increased $665 million or 6%, mainly due to increased investment in new
products and services, including $739 million higher NDS expenses, offset in part by reduced headcount-related
expenses.
Fiscal year 2014 compared with fiscal year 2013
Research and development expenses increased $970 million or 9%, mainly due to increased investment in new
products and services in our Devices engineering group, including $275 million of NDS expenses, and increased
investment in our Applications and Services engineering group.