Microsoft 2015 Annual Report Download - page 24
Download and view the complete annual report
Please find page 24 of the 2015 Microsoft annual report below. You can navigate through the pages in the report by either clicking on the pages listed below, or by using the keyword search tool below to find specific information within the annual report.-
 1
1 -
2
-
3
-
4
-
5
-
6
-
7
-
8
-
9
-
10
-
11
-
12
-
13
-
 14
14 -
 15
15 -
 16
16 -
 17
17 -
 18
18 -
 19
19 -
 20
20 -
 21
21 -
 22
22 -
 23
23 -
 24
24 -
 25
25 -
 26
26 -
 27
27 -
 28
28 -
 29
29 -
 30
30 -
 31
31 -
 32
32 -
 33
33 -
 34
34 -
35
-
36
-
37
-
38
-
39
-
40
-
41
-
42
-
43
-
44
-
45
-
46
-
47
-
48
-
49
-
50
-
51
-
52
-
53
-
54
-
55
-
56
-
57
-
58
-
59
-
60
-
61
-
62
-
63
-
64
-
65
-
66
-
67
-
68
-
69
-
70
-
71
-
72
-
73
-
74
-
75
-
76
-
77
-
78
-
79
-
80
-
81
-
82
-
83
-
84
-
85
-
86
-
87
-
88
-
89
 |
 |

23
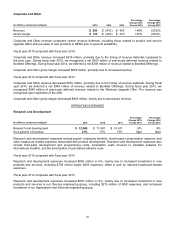
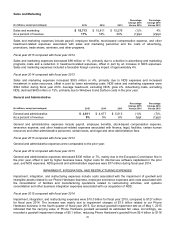
SUMMARY RESULTS OF OPERATIONS
(In millions, except percentages and per share
amounts) 2015 2014 2013
Percentage
Change 2015
Versus 2014
Percentage
Change 2014
Versus 2013
Revenue $ 93,580 $ 86,833 $ 77,849 8% 12%
Gross margin $60,542 $59,755 $57,464 1% 4%
Operating income $18,161 $27,759 $26,764 (35)% 4%
Diluted earnings per share $1.48 $2.63 $2.58 (44)% 2%
Fiscal year 2015 compared with fiscal year 2014
Revenue increased $6.7 billion or 8%, reflecting a full year of Phone Hardware sales and growth in revenue from our
Commercial Cloud, Surface, server products, search advertising, and Xbox Live transactions. These increases were
offset in part by a decline in revenue from Office Commercial, Windows OEM, licensing of Windows Phone operating
system, and Office Consumer. Revenue included an unfavorable foreign currency impact of approximately 2%.
Gross margin increased $787 million or 1%, primarily due to higher revenue, offset in part by a $6.0 billion or 22%
increase in cost of revenue. Cost of revenue increased, mainly due to Phone Hardware, as well as increasing costs
in support of our Commercial Cloud, including $396 million of higher datacenter expenses. Gross margin, as a
percentage of revenue, improved year over year in each of our reportable segments.
Operating income decreased $9.6 billion or 35%, primarily due to impairment, integration, and restructuring expenses
in the current year, as well as increased research and development expenses, offset in part by higher gross margin.
Key changes in operating expenses were:
• Impairment, integration, and restructuring expenses were $10.0 billion in the current year, reflecting
goodwill and asset impairment charges of $7.5 billion related to our Phone Hardware business, and $2.5
billion of integration and restructuring expenses, driven by costs associated with our restructuring plans.
• Research and development expenses increased $665 million or 6%, mainly due to increased investment
in new products and services, including NDS expenses, offset in part by reduced headcount-related
expenses.
Diluted earnings per share (“EPS”) were negatively impacted by impairment, integration, and restructuring expenses,
which decreased diluted EPS by $1.15.
Fiscal year 2014 compared with fiscal year 2013
Revenue increased $9.0 billion or 12%, demonstrating growth across our consumer and commercial businesses,
primarily due to higher revenue from server products, Xbox Platform, Commercial Cloud, and Surface. Revenue also
increased due to the acquisition of NDS. Commercial Cloud revenue doubled, reflecting continued subscriber growth
from our cloud-based offerings.
Gross margin increased $2.3 billion or 4%, primarily due to higher revenue, offset in part by a $6.7 billion or 33%
increase in cost of revenue. Cost of revenue increased mainly due to higher volumes of Xbox consoles and Surface
devices sold, and $575 million of higher datacenter expenses, primarily in support of Commercial Cloud revenue
growth. Cost of revenue also increased due to the acquisition of NDS.
Operating income increased $995 million or 4%, reflecting higher gross margin, offset in part by increased research
and development expenses and sales and marketing expenses. Key changes in operating expenses were:
• Research and development expenses increased $970 million or 9%, mainly due to increased investment
in new products and services in our Devices engineering group, including NDS expenses, and increased
investment in our Applications and Services engineering group.
• Sales and marketing expenses increased $535 million or 4%, primarily due to NDS expenses and
increased investment in sales resources, offset in part by lower advertising costs.